Piezīme
Lai piekļūtu šai lapai, ir nepieciešama autorizācija. Varat mēģināt pierakstīties vai mainīt direktorijus.
Lai piekļūtu šai lapai, ir nepieciešama autorizācija. Varat mēģināt mainīt direktorijus.
The topic analytics pane provides a view into the performance of an individual topic and how it can be improved.
Note
Topics analytics is available for agents in classic mode only.
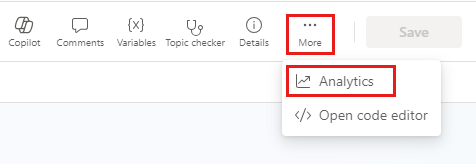
To display the topic analytics pane, open the desired topic from the Topics page, then select More > Analytics.
Analytics are only available for topics associated with an analytics session.
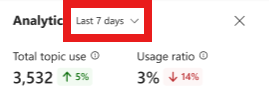
To change the time range, select  at the top of the topic analytics pane.
The topic analytics pane shows three charts or metrics:
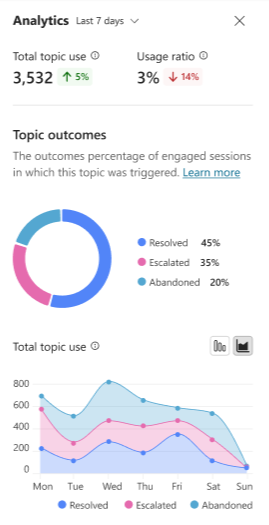
- The total number of times the topic was associated with a session, and how often the topic appeared as a percentage of all topics associated with a session
- A chart showing the aggregated breakdown by outcome for the selected period
- A chart showing the outcomes of the sessions where the topic appeared over time
Note
In classic chatbot analytics, you can also select the Detail link for the topic in one of the following charts on the Summary or Customer Satisfaction tabs: