Note
Access to this page requires authorization. You can try signing in or changing directories.
Access to this page requires authorization. You can try changing directories.
These are the latest features in the Stable release of Microsoft Edge DevTools.
Video: What's new in DevTools 111
Remote debugging of Microsoft Edge, PWAs, and WebView2 controls on HoloLens 2 devices
The Remote Tools for Microsoft Edge app is now available on HoloLens 2 devices. The Remote Tools for Microsoft Edge app is a plug-in for the Windows Device Portal for Desktop that enables remote debugging for tabs in Microsoft Edge, Progressive Web Apps (PWAs), and WebView2 controls. By using remote debugging, you can run web content on a remote device and debug it right from your development machine.
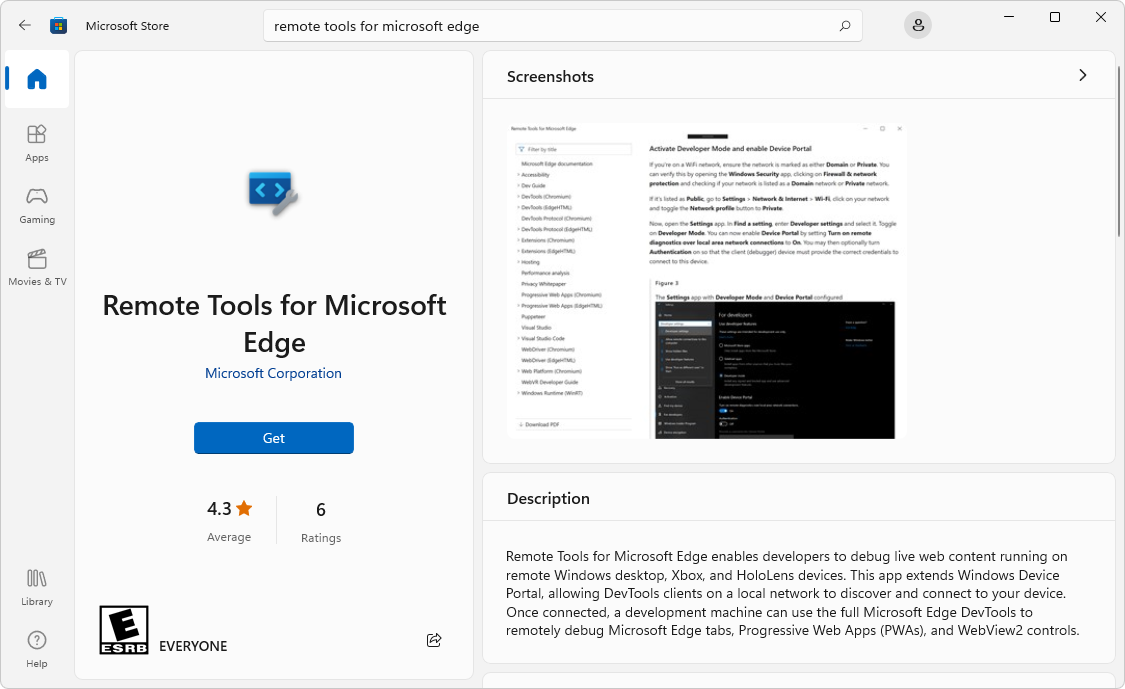
With remote debugging enabled, you don't need to open DevTools on HoloLens 2 devices any more. Instead, you can connect to the remote HoloLens 2 device using the Device portal, open the edge://inspect page, and then select the target (tab, PWA, or WebView2 control) that you want to use with DevTools.
To give us feedback on the remote debugging flow for Microsoft Edge, leave a comment in Issue 136: Remote debugging HoloLens 2 devices is now available with the latest version of the Remote Tools for Microsoft Edge app.
See also:
- Remotely debug Windows devices
- Windows Device Portal for Desktop
- Remote debugging HoloLens 2 WebView2 WinUI 2 (UWP) apps
Device Mode toolbar has emulation controls for themes and vision deficiencies
In previous versions of Microsoft Edge, to emulate different themes or vision deficiencies, you would use the Rendering tool to, for example, emulate Achromatopsia, which is when the user is unable to perceive any color.
In Microsoft Edge 111, you can now access these theme and vision deficiency emulation controls directly from the Device Mode toolbar, in addition to using the Rendering tool.
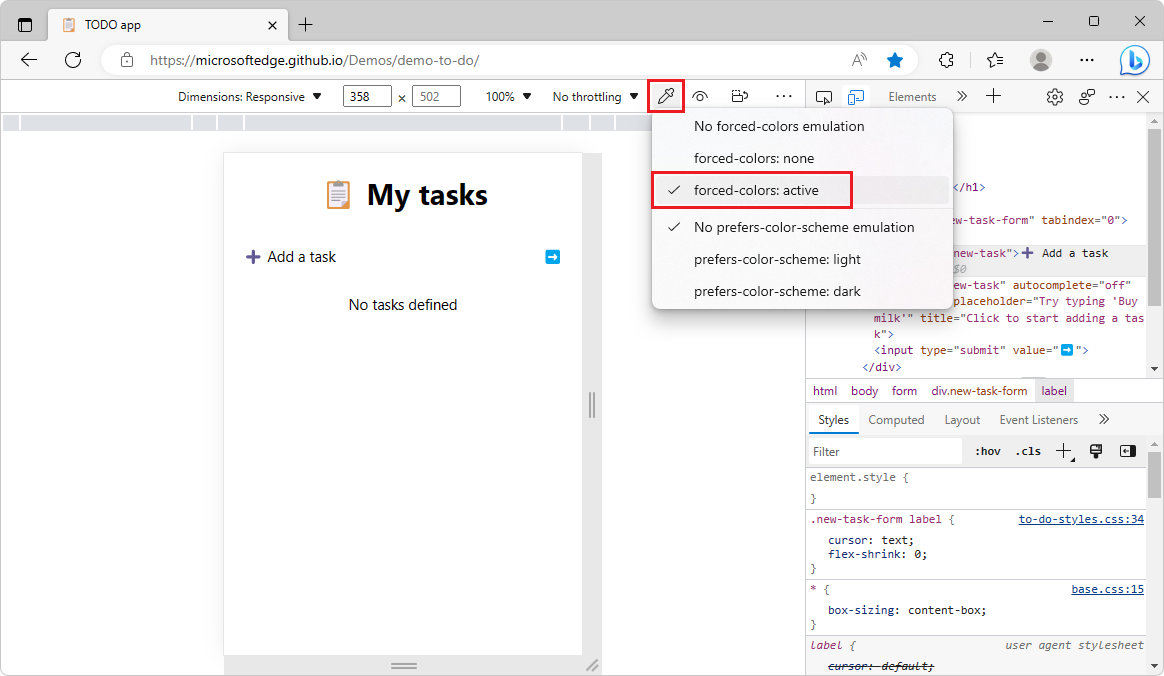
For example, to emulate high contrast mode and test how your web content responds:
- In the Device Mode toolbar, to the right of the Throttling dropdown list, click Emulate Media Features (the Eyedropper icon,
 ).
). - Select forced-colors: active:
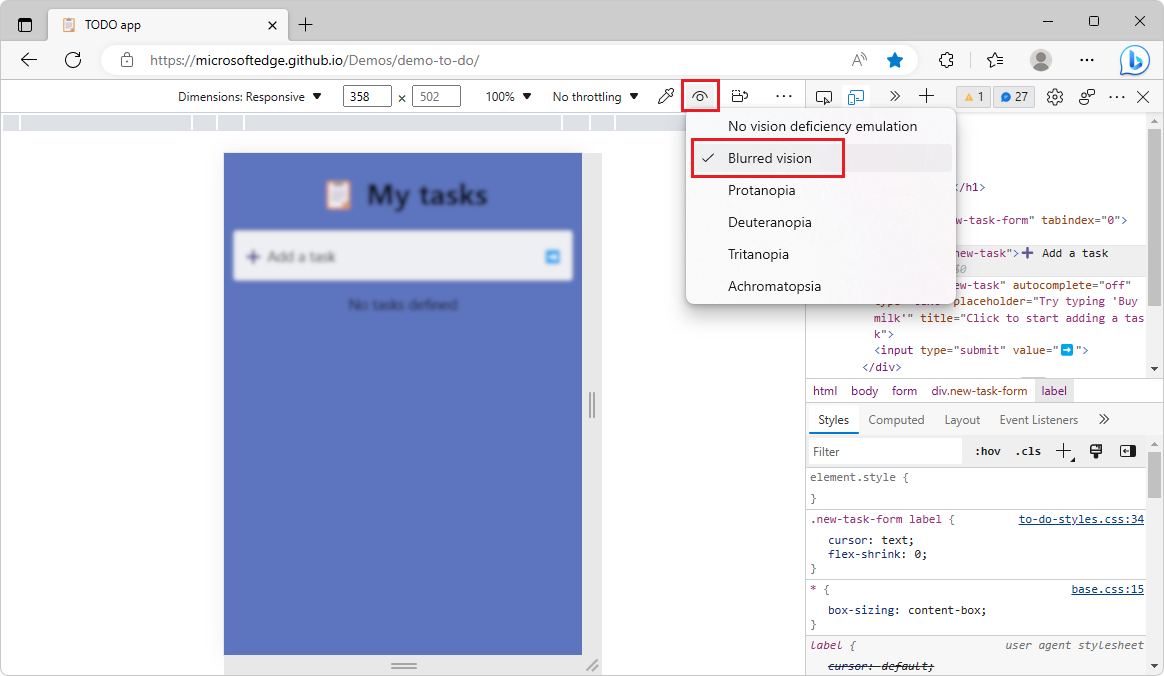
You can also emulate vision deficiencies by clicking the Eye icon next to the Eyedropper icon. For example, to emulate blurred vision:
- Click Emulate Vision Deficiency (the eye icon,
 ).
). - Select Blurred vision:
See also:
- Emulate mobile devices (Device Emulation)
- Check for contrast issues with dark theme and light theme
- Emulate vision deficiencies
Performance tool unminifies file and function names when profiling production code
Microsoft Edge 99 added a new feature to the Performance tool called Unminify. This Unminify feature applied sourcemaps to a profile that was recorded with the Performance tool, and then downloaded the unminified profile to your machine. The Unminify feature is described in Use your source maps to display original function names in performance profiles in What's New in DevTools (Microsoft Edge 99).
In Microsoft Edge 111, this feature has been removed, because the Performance tool now automatically provides the original file and function names while profiling production code, as long as source maps are loaded. Source maps can be loaded reliably and securely by hosting them on Azure Artifacts Symbol Server.
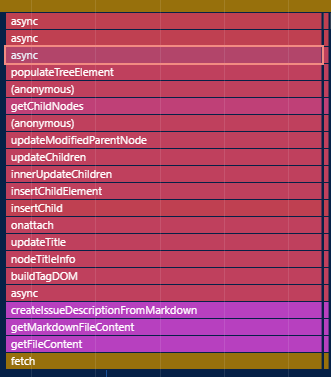
In the following image, you see minified function names in the flame chart when profiling production code:
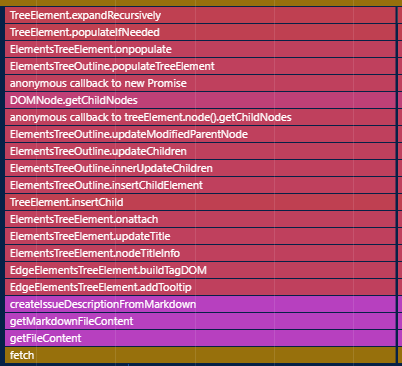
Now in Microsoft Edge 111, the Performance tool automatically unminifies function names in the flame chart when profiling production code:
See also:
- Securely debug original code by publishing source maps to the Azure Artifacts symbol server
- Securely debug original code by using Azure Artifacts symbol server source maps
- Record performance in Performance features reference.
The Styles pane is easier to use in Focus Mode
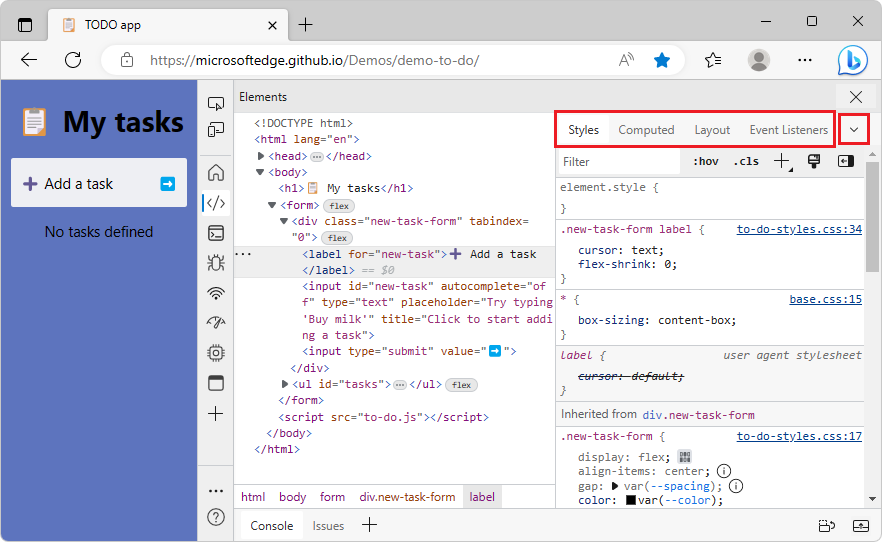
In previous versions of Microsoft Edge, in Focus Mode, the Elements tool didn't provide an easy way to access all of the tabs within the Styles pane. In Microsoft Edge 111, this issue has been fixed. When the Styles pane has a narrow viewport and can't display all of the other available tabs, click the More tabs expander icon (![]() ):
):
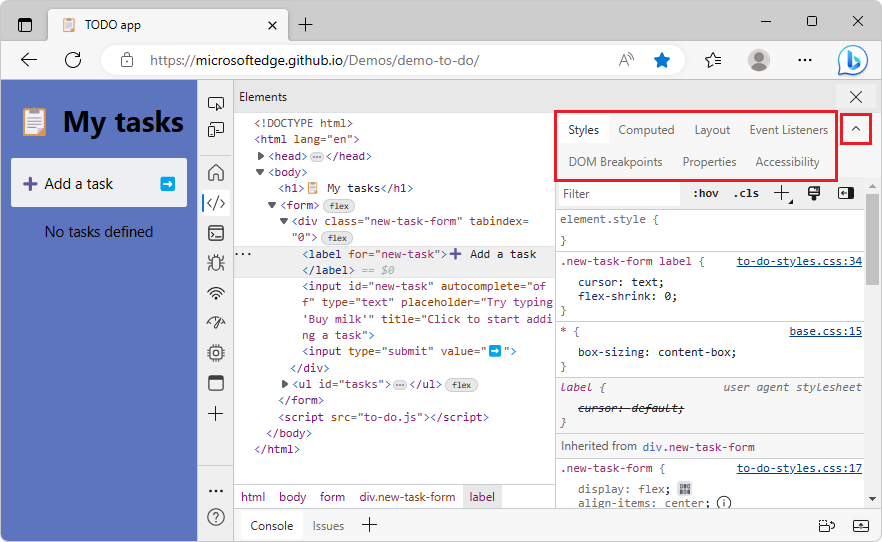
To display only a few of the tabs within the Styles pane, click the More tabs collapser icon (![]() ):
):
See also:
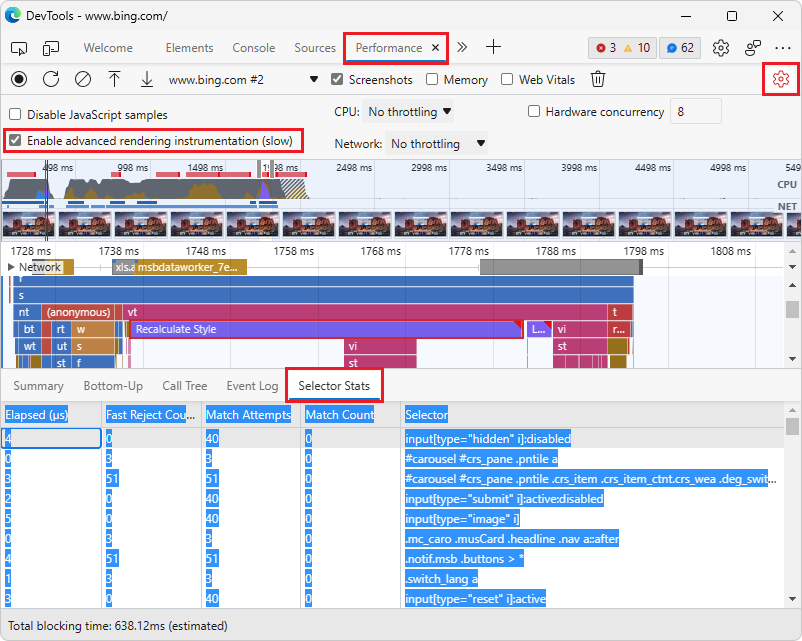
Copy Selector Stats table from Performance tool to Excel
Microsoft Edge 109 introduced the Selector Stats feature in the Performance tool. With the Enable advanced rendering instrumentation (slow) setting turned on in the Performance tool, selecting any Recalculate Styles event in the flame chart adds a Selector Stats tab in the bottom pane. See Debug long-running Recalculate Style events with new selector stats in What's New in DevTools (Microsoft Edge 109).
In Microsoft Edge 111, you can now export the Selector Stats table for each Recalculate Styles event to a Microsoft Excel workbook. You can then use Excel to do aggregate selector performance analysis, and identify the most costly selectors over the lifetime of the profile.
To export the Selector Stats table:
- Click the upper left cell with the mouse, and then drag to select to the bottom right cell.
- Right-click the table, and then select Copy. Or, press Ctrl+C (Windows, Linux) or Command+C (macOS).
- Paste the table into Excel.
See also:
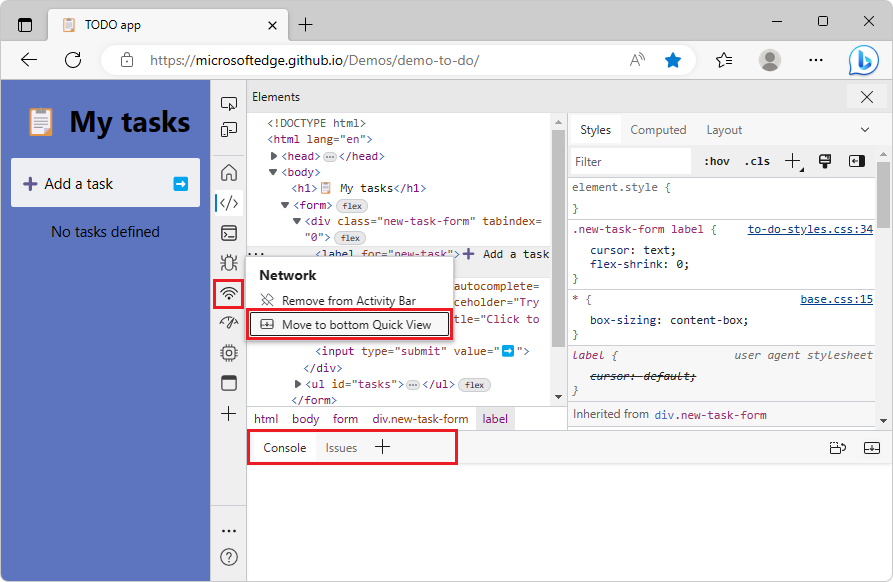
In Focus Mode, assistive technology announces when you move a tool to Quick View
In previous versions of Microsoft Edge, assistive technology, such as screen readers, didn't announce confirmation when moving a tool from the Activity Bar to the Quick View toolbar. In Microsoft Edge 111, this issue has been fixed. Screen readers now announce "Successfully added Network to Quick View" when you move the Network tool from the Activity Bar to the Quick View toolbar:
See also:
Announcements from the Chromium project
Microsoft Edge 111 also includes the following updates from the Chromium project:
- Debugging HD color with the Styles pane
- Enhanced breakpoint UX
- Better syntax highlight for Angular
- Reorganize caches in the Application panel