Note
Access to this page requires authorization. You can try signing in or changing directories.
Access to this page requires authorization. You can try changing directories.
These are the latest features in the Stable release of Microsoft Edge DevTools.
Tip
The Microsoft Build 2023 conference was on May 23-25, 2023. Learn more about new features for memory, performance, and production debugging in DevTools, as well as new capabilities for PWAs in the sidebar, WebView2, and Chat Plugins, in the following videos:
Video: What's New in DevTools 113 and 114
Aggregate Selector Stats in the Performance tool
Microsoft Edge 109 added the Selector Stats feature to the Performance tool. You can use the data from Selector Stats to understand which CSS selectors are taking the most time during Recalculate Style events in the Performance tool and are contributing to slow performance.
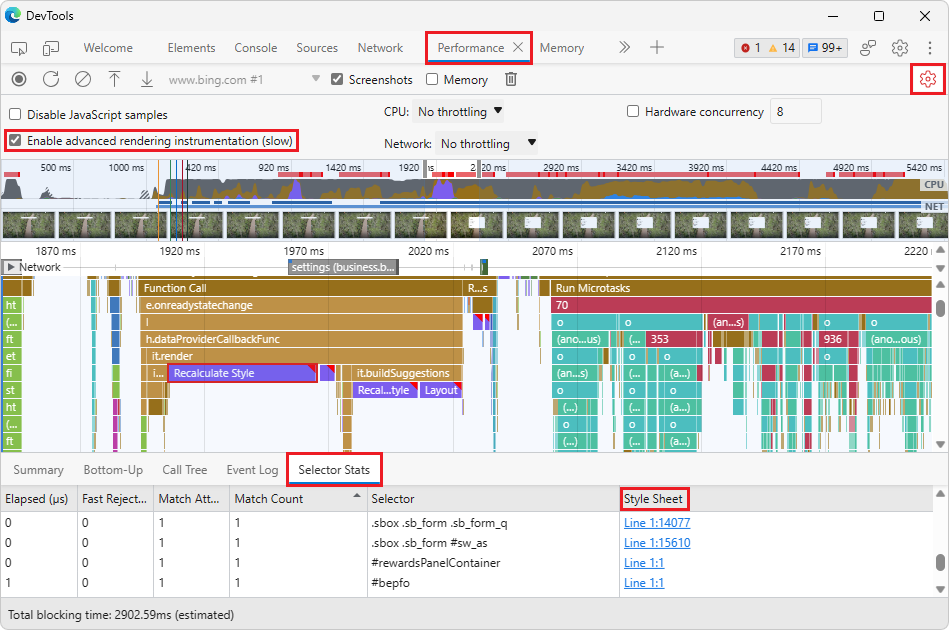
In Microsoft Edge 114, you no longer need to select an individual Recalculate Style event to see the selectors that were recalculated during that event. Instead, the Selector Stats tab in the bottom pane of the Performance tool automatically aggregates the data across all of the Recalculate Style events in the recorded profile. As you zoom into specific parts of the profile, the Selector Stats tab updates to only show data from the portion of the profile that you are currently analyzing.
Also, a new Style Sheet column has been added to the Selector Stats tab. The Style Sheet column contains a link for each selector back to the stylesheet where the selector is defined.
Thank you for using the Selector Stats feature and sharing your feedback with us in GitHub Issue #98: [Feedback] Selector Performance Tracing Explainer!
See also:
- Analyze CSS selector performance during Recalculate Style events
- GitHub Issue #98: [Feedback] Selector Performance Tracing Explainer
- Debug long-running Recalculate Style events with new selector stats in What's New in DevTools (Microsoft Edge 109).
The Issues tool and Styles pane warn about CSS properties that trigger Layout
DevTools now detects and warns about CSS properties that can cause Layout-based performance issues when using CSS animation in the webpage, such as moving text. Layout is the web browser process for recalculating the positions and geometries of elements in the document, to re-render part or all of the document. Because Layout is a user-blocking operation in the browser, we recommend limiting Layout as much as possible, to keep your web content smooth and responsive to interaction.
Some CSS properties don't trigger a Layout operation, because they run on the compositor thread in the browser, such as transform and opacity. However, even CSS properties that don't trigger Layout can trigger a Paint operation which, when used in combination with CSS animations, can lead to a negative performance impact.
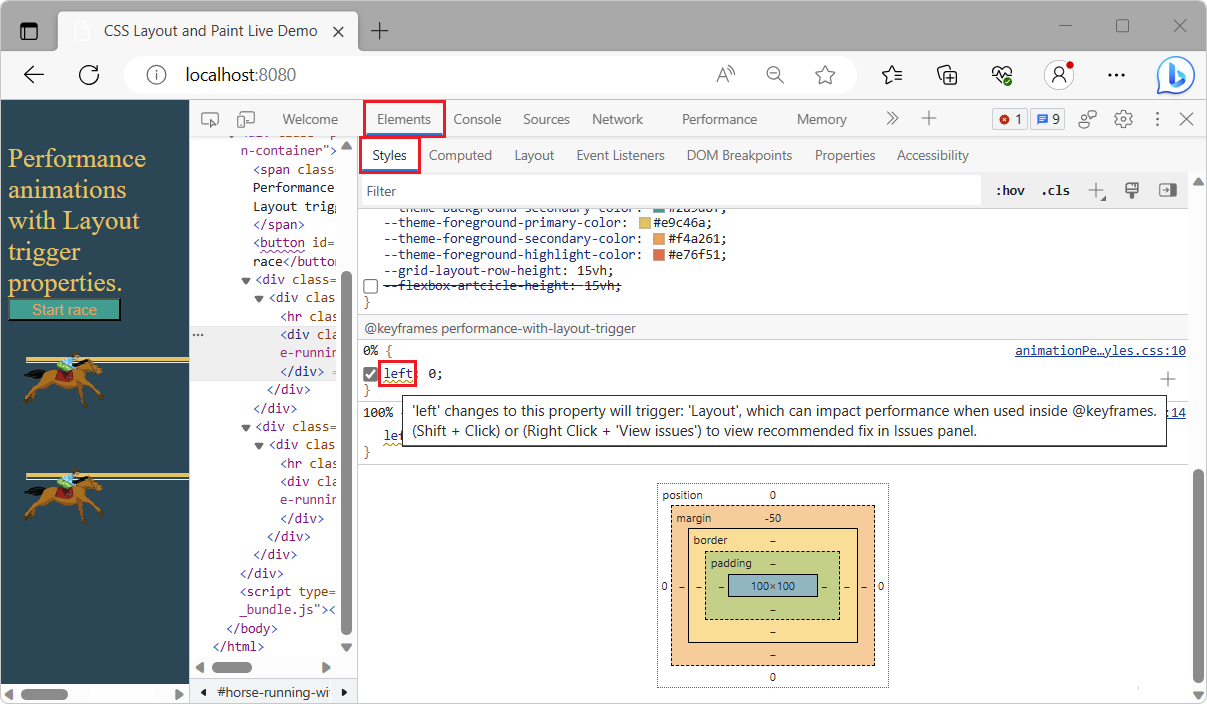
In the Styles pane in the Elements tool, a wavy underline and tooltip has been added on CSS properties that trigger Layout or Paint operations. To view the issue in a tooltip, hover over the wavy underline:
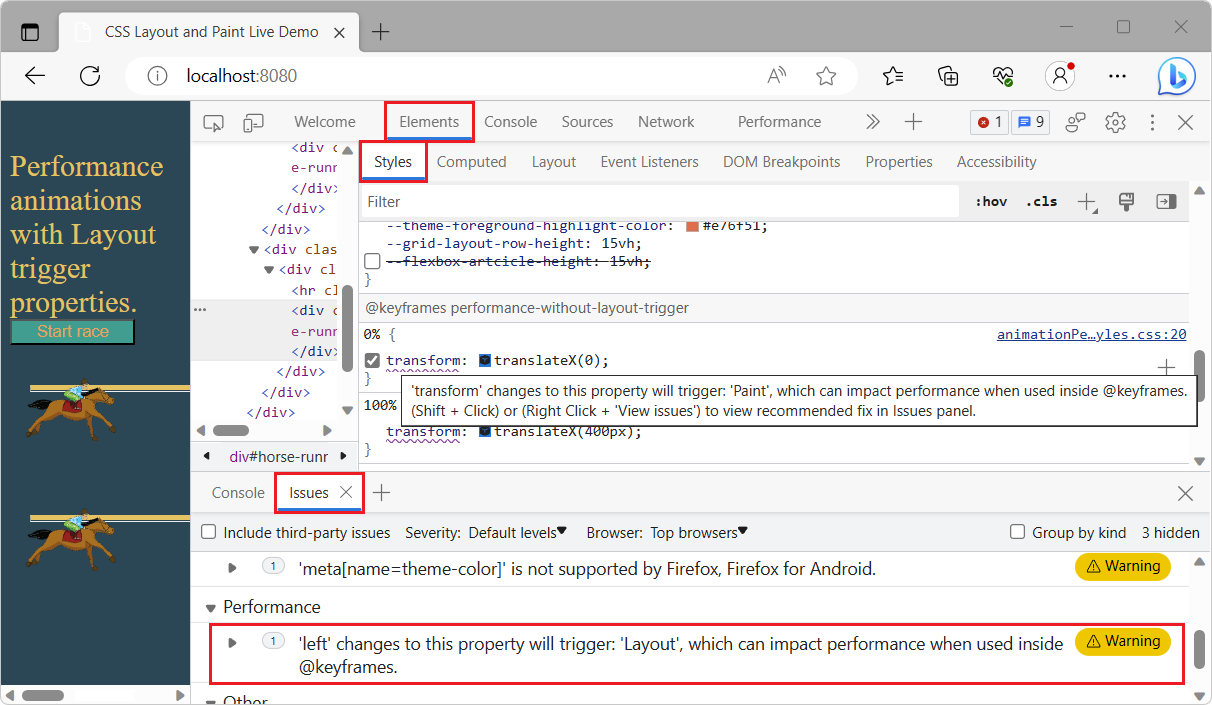
In the Issues tool, in the Performance category, a new kind of issue is reported, such as "Changes to this property will trigger: 'Layout', which can impact performance when used inside @Keyframes." When you're using the Styles pane, to open the issue in the Issues tool, Shift+click the wavy underline on such a property, or right-click the wavy underline and then select View issues. The Issues tool opens in the Drawer (now Quick View panel) at the bottom of DevTools:
See also:
- Minimizing browser reflow | PageSpeed Insights - reflow includes Paint, Composite, and Layout operations.
- Layout in Troubleshooting common performance issues.
- Open issues from the DOM tree in Find and fix problems using the Issues tool.
- Using CSS animations, at MDN.
- Inspect and modify CSS animation effects
The Memory tool can load enhanced traces larger than 1 GB
In previous versions of Microsoft Edge, loading an enhanced trace larger than 1 GB failed. In Microsoft Edge 114, this issue has been fixed. You can now successfully load enhanced traces of any size.
Enhanced traces is an experimental feature in Microsoft Edge that allows you to export and import entire DevTools instances, saved as .devtools files, with as much state as possible preserved across the Memory, Performance, Elements, Console, and Sources tools. A .devtools file opens in a separate DevTools instance, and loads the following trace information, while retaining references to source code:
- DOM snapshots.
- Console messages.
- Heap snapshots.
- Performance profiles.
See also:
- Share enhanced performance and memory traces
- GitHub Issue #122: [Feedback] Enhanced Traces experiment
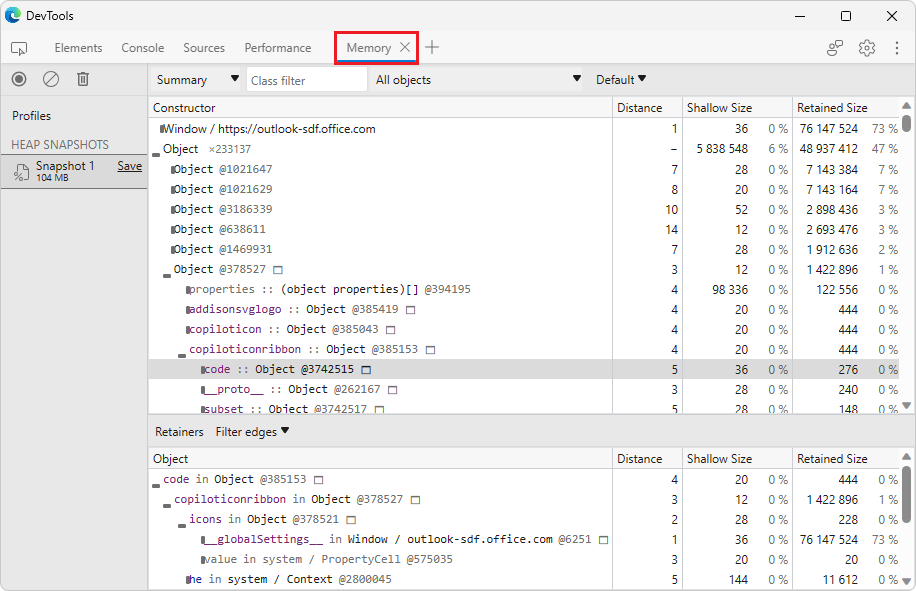
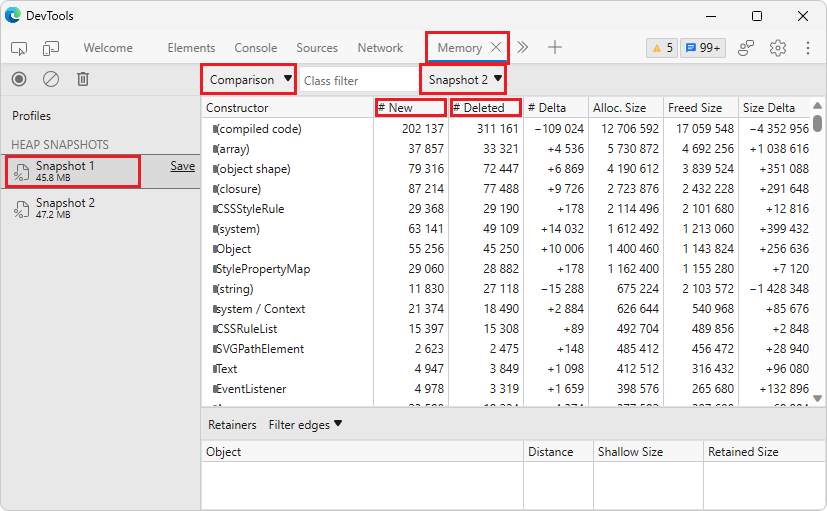
The Memory tool more accurately compares two heap snapshots
In the Memory tool, you can take multiple heap snapshots and compare them to find differences in the objects in the heap. In previous versions of Microsoft Edge, the Memory tool reported too many new and deleted objects when comparing heap snapshots, because object IDs weren't being tracked consistently by the tool. Actually, many of these are likely the same objects.
In Microsoft Edge 114, this issue has been fixed, by ensuring that consistent object IDs are tracked across multiple snapshots.
See also:
- View snapshots in Record heap snapshots using the Memory tool ("Heap snapshot" profiling type).
- Change List 4278992: Produce consistent IDs for Oilpan objects in heap snapshots
- Issue 1286500: Heap snapshot comparison incorrectly reports large numbers of new and deleted objects
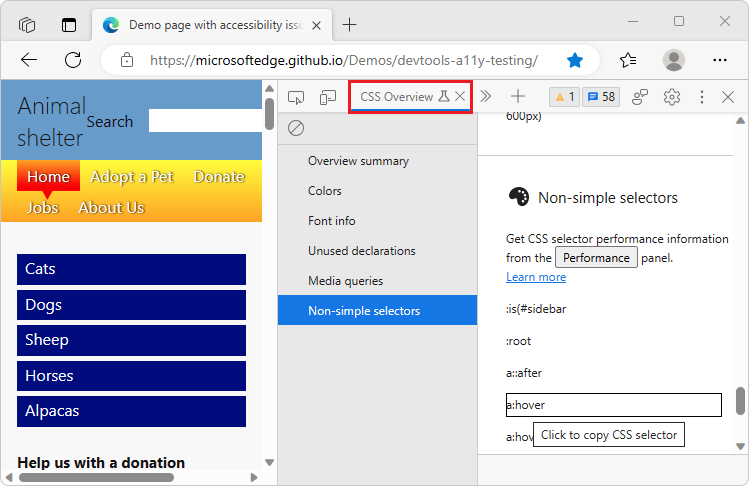
Accessibility improvements for the CSS overview tool
In Microsoft Edge 112, the CSS overview tool was updated to display a list of non-simple selectors when taking an overview snapshot of a webpage's CSS. In Microsoft Edge 114, the Non-simple selectors section of the CSS overview tool is now easier to use with assistive technology, such as screen readers.
When you click a selector, or navigate to a selector and then press Enter, screen readers now announce "Copied CSS selector":
See also:
- CSS overview tool displays non-simple selectors for quick performance gains in What's New in DevTools (Microsoft Edge 112).
- Non-simple selectors in Optimize CSS styles with the CSS overview tool.
- Navigate DevTools with assistive technology
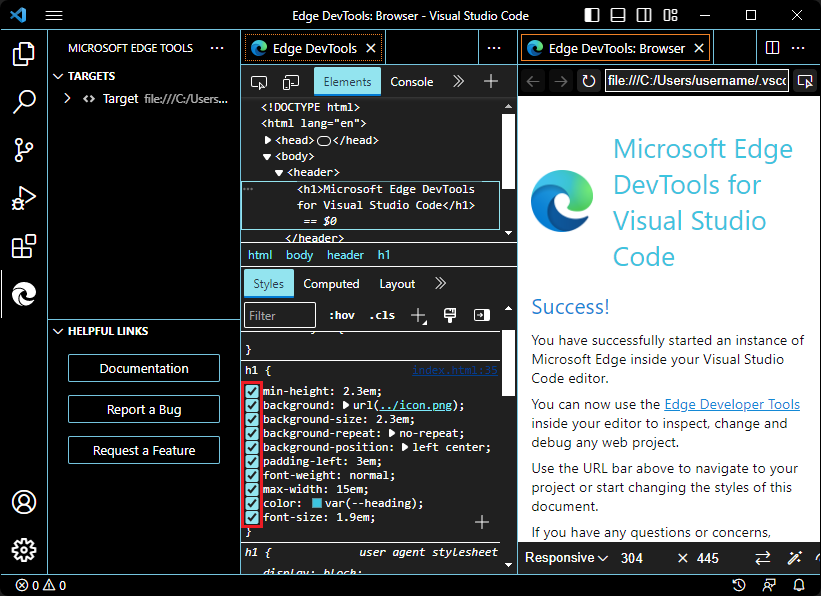
DevTools extension for VS Code has better support for high contrast mode
In previous versions of the Microsoft Edge DevTools extension for Visual Studio Code, in high contrast mode, hovering over icons within the tools didn't render the UI controls with sufficient contrast. This issue has been fixed.
For example, in the Styles pane in the Elements tool, checkboxes for applying styles to elements now render correctly in high contrast mode:
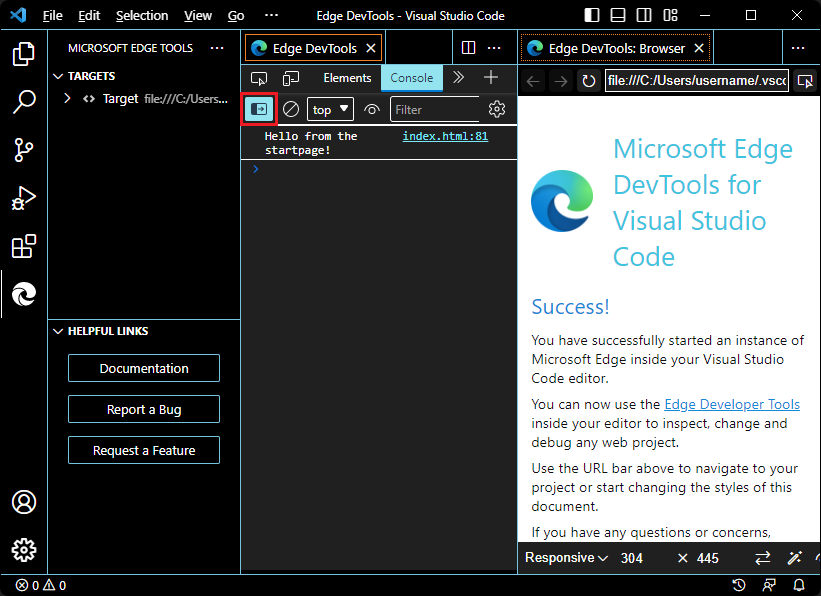
Also, in the Console tool, icons such as Show console sidebar now render correctly in high contrast mode:
See also:
- Microsoft Edge DevTools extension for Visual Studio Code
- Turn high contrast mode on or off in Windows
Announcements from the Chromium project
Microsoft Edge 114 also includes the following updates from the Chromium project:
- Debug Autofill using the Elements panel and Issues tab
- Lighthouse 10.1.1
- Performance enhancements
- JavaScript Profiler deprecation: Phase three