Create a KQL database
In Real-Time Intelligence, you interact with your data in the context of eventhouses, databases, and tables. A single workspace can hold multiple Eventhouses, an eventhouse can hold multiple databases, and each database can hold multiple tables.
In this article, you learn how to create a new KQL database. Once your KQL database has data, you can proceed to query your data using Kusto Query Language in a KQL queryset.
Prerequisites
Create a new KQL database
To create a new KQL database, in the Eventhouse explorer either:
Select Eventhouse then New database +
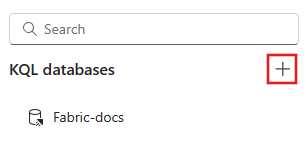
Under KQL Databases select +
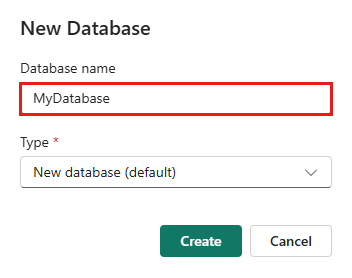
Enter your database name, select your database type, either New database (default) or New shortcut database (follower), then select Create. For information about follower databases, see Create a database shortcut.
Note
The database name can contain alphanumeric characters, underscores, periods, and hyphens. Special characters aren't supported.
The KQL database is created within the context of the selected eventhouse.
Explore your KQL database
When you create a new KQL database, an attached environment is automatically created to explore and manage the KQL database using KQL queries. For more information, see KQL overview.
To access the query environment, select KQLdatabasename_queryset from your KQL database object tree.
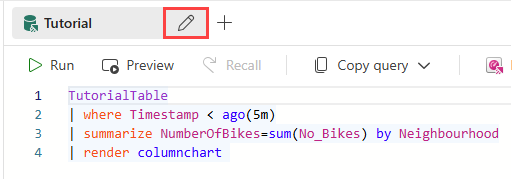
To rename the query environment, select the Pencil icon next to its name, and enter a new name.
Database details
The main page of your KQL database shows an overview of the contents of your database. The following tables list the available information in the center and right information panes.
Database right pane details
The right information pane displays the details of the selected database.
Card | Item | Description |
---|---|---|
Size | ||
Compressed | Total size of compressed data. | |
Original size | Total size of uncompressed data. | |
OneLake | ||
Availability | Set OneLake availability to On or Off. When OneLake availability is turned on, tables can't be renamed. | |
Latency | The maximum time until data is available across tables in OneLake. | |
Table number | The number of tables available in OneLake. | |
OneLake folder | OneLake folder path that can be used for creating shortcuts. | |
Overview | ||
Created by | The user name of person who created the database, if available, and the database creation date. | |
Region | Shows the region where your capacity is hosted. For more information, see Fabric region availability. | |
Query URI | The URI used to run queries or management commands. | |
Ingestion URI | The date of the last data ingestion and the URI that can be used to get data. | |
Caching Policy | The time period in which data is cached and kept in local SSD storage. For more information, see Caching policy. | |
Retention Policy | The time period after which data is automatically removed from tables or materialized views. For more information, see Data retention policy. |
Database center information pane
The center database information pane depicts a histogram of the ingestion data, table information, and a means to preview the database ingestion information.
Card | Item | Description |
---|---|---|
Histogram | ||
Number of rows | The number of rows loaded into the database in the selected time range. | |
Last run | The time when the histogram was last generated. | |
Interval | Set the interval of the histogram display. Set intervals by one hour, six hours, one day, three days, seven days, and 30 days. | |
Refresh | Refresh your histogram. | |
Histogram | The ingestion histogram displays data by the interval chosen. The interval is calculated by a full coordinated universal time (UTC) day, but displays according to the local time. | |
Tables | ||
Search for table | Search for a database table. | |
New table | Create a new table | |
Tables display | View table information by Cards or by List view. Cards and list view both display table name, Compressed size, Last ingestion, and OneLake availability or latency. Cards uniquely display a histogram of the database ingestion over the past seven days, the number of rows ingested in the last ingestion, and the table creator profile. The list view display also shows total Row count, Caching, and Retention. |
|
Data preview | ||
Data preview | Shows a preview of the last 100 records ingested for each table. Displays Ingestion time, TableName, and Record. Select Columns to select columns and values for a Pivot view. |
Table details
Select a table in your KQL database to see an overview of the table. The following tables list the available information in the center and right information panes.
Table right pane details
The right information pane displays the details of the selected table.
Card | Item | Description |
---|---|---|
Size | ||
Compressed | Total size of compressed data. | |
Original size | Total size of uncompressed data. | |
OneLake | ||
Availability | Set OneLake availability to On or Off. When OneLake availability is turned on, tables can't be renamed. | |
Latency | The maximum time until table data is available in OneLake. | |
Since | The start time from when availability is recorded. | |
OneLake folder | OneLake folder path that can be used for creating shortcuts. | |
Overview | ||
Row count | The number of rows in the table. | |
Rows ingested last 24 h | The number of rows ingested in the last 24 hours. | |
Schema last altered by | When the schema was last altered and by whom. | |
Ingestion URI | The date of the last data ingestion and the URI that can be used to get data. | |
Caching Policy | The time period in which data is cached and kept in local SSD storage. For more information, see Caching policy. | |
Retention Policy | The time period after which data is automatically removed from tables or materialized views. For more information, see Data retention policy. |
Table center information pane
The center database information pane depicts a histogram of the ingestion data, table information, and a means to preview the database ingestion information.
Card | Item | Description |
---|---|---|
Histogram | ||
Number of rows | The number of rows ingested into the database. | |
Last run | The time when the histogram was last generated. | |
Interval | Set the interval of the histogram display. Set intervals by one hour, six hours, one day, three days, seven days, and 30 day intervals. The interval is calculated by a full coordinated universal time (UTC) day, but displays according to the local time. | |
Refresh | Refresh your histogram. | |
Histogram | The ingestion histogram displays data by the interval chosen. | |
Data preview | ||
Quick query | Shows a preview of the table ingestion results. Displays Ingestion time, TableName, and Record. Select Columns to select columns and values for a Pivot view. | |
Schema insights | ||
Columns | For each column in a table, shows insights for column values, such as date ranges, minimum and maximum values, or the number of unique values. | |
Top 10 | Select a column listed in the Columns section to display the top 10 values for that column. |