Case study: Isolate a performance issue (C#, Visual Basic, F#)
Use the profiling tools to investigate performance issues and isolate problem areas. This case study uses a sample application with performance issues to demonstrate how to use profiling tools to improve efficiency. If you want to compare profiling tools, see Which tool should I choose?
This case study covers these topics:
- How to use Visual Studio profiling tools to analyze application performance.
- How to interpret the data provided by these tools to identify performance bottlenecks.
- How to apply practical strategies to optimize code, focusing on .NET Counters, call counts, and timing data.
Follow along and then apply these techniques to your own applications to make them more efficient and cost-effective.
Isolate a performance issue case study
The sample application in this case study is an ASP.NET app that runs queries against a simulated database. The example is based on the Diagnostics Sample.
The primary performance issue with the sample application lies in inefficient coding patterns. The application has a performance bottleneck that significantly impacts its efficiency. The problem includes the following symptoms:
Low CPU Usage: The application shows low CPU usage, indicating that the CPU is not the bottleneck.
High ThreadPool Thread Count: The thread count is relatively high and steadily rising, suggesting thread pool starvation.
Slow Application Response: The application responds slowly due to the lack of available threads to process new work items.
The case study aims to address these issues by employing Visual Studio's profiling tools to analyze the application's performance. By understanding where and how the application's performance can be improved, developers can implement optimizations to make code faster and more efficient. The ultimate goal is to enhance the application's overall performance, making it more efficient and cost-effective to run.
Challenge
Addressing the performance issues in the sample .NET application presents several challenges. These challenges stem from the complexity of diagnosing performance bottlenecks. The key challenges in fixing the problems described are as follows:
Diagnosing Performance Bottlenecks: One of the primary challenges is accurately identifying the root causes of the performance issues. Low CPU usage combined with slow performance can have multiple contributing factors. Developers must use profiling tools effectively to diagnose these issues, which requires some understanding of how these tools work and how to interpret their output.
Knowledge and Resource Constraints: Teams may face constraints related to knowledge, expertise, and resources. Profiling and optimizing an application requires specific skills and experience, and not all teams may have immediate access to these resources.
Addressing these challenges requires a strategic approach that combines effective use of profiling tools, technical knowledge, and careful planning and testing. The case study aims to guide developers through this process, providing strategies and insights to overcome these challenges and improve the application's performance.
Strategy
Here is a high-level view of the approach in this case study:
- We start the investigation by watching .NET counter metrics while collecting performance data. Like the CPU Usage tool, Visual Studio's .NET Counters tool is also a good starting point for a performance investigation.
- Next, for additional insights to help isolate issues or improve the performance, consider collecting a trace using one of the other profiling tools. For example, take a look at call counts and timing data using the Instrumentation tool.
Data collection requires the following tasks:
- Setting the app to a Release build.
- Select the .NET Counters tool from the Performance Profiler (Alt+F2). (Later steps involve the Instrumentation tool.)
- From the Performance Profiler, start the app and collect a trace.
Check performance counters
While running the app, we observe the counters in the .NET Counters tool. For initial investigations, a few key metrics to keep an eye on include:
CPU Usage. Watch this counter to see whether a performance issue occurs with high or low CPU usage. This can be a clue to specific types of performance issues. For example:- With high CPU usage, use the CPU Usage tool to identify areas where we may be able to optimize code. For a tutorial on this, see Case study: Beginner's guide to optimizing code.
- With low CPU usage, use the Instrumentation tool to identify call counts and average function time based on wall clock time. This may help identify issues such as contention or thread pool starvation.
Allocation Rate. For a web app serving requests, the rate should be fairly steady.GC Heap Size. Watch this counter to see if memory usage is growing continually and potentially leaking. If it seems high, use one of the memory usage tools.Threadpool Thread Count. For a web app serving requests, watch this counter to see if the thread count is holding steady or rising at a steady rate.
Here's an example showing how the CPU Usage is low, while the ThreadPool Thread Count is relatively high.
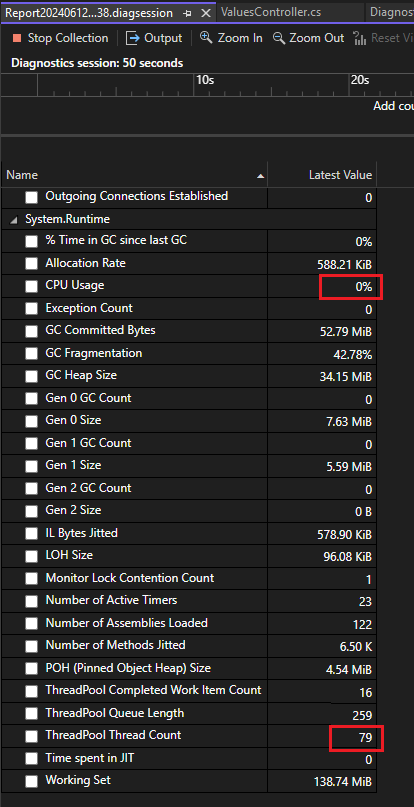
A steadily rising thread count with a low CPU usage can be an indicator of thread pool starvation. The thread pool is forced to keep spinning new threads. Thread pool starvation occurs when the pool has no available threads to process new work items and it often causes applications to respond slowly.
Based on the low CPU usage and the relatively high thread count, and working on the theory of a possible case of thread pool starvation, switch to using the Instrumentation tool.
Investigate call counts and timing data
Let's take a look at a trace from the Instrumentation tool to see if we can try to find out more about what is happening with the threads.
After collecting a trace with the Instrumentation tool and loading it into Visual Studio, we first check the initial .diagsession report page that shows summarized data. In the collected trace, we use the Open details link in the report and then select Flame Graph.
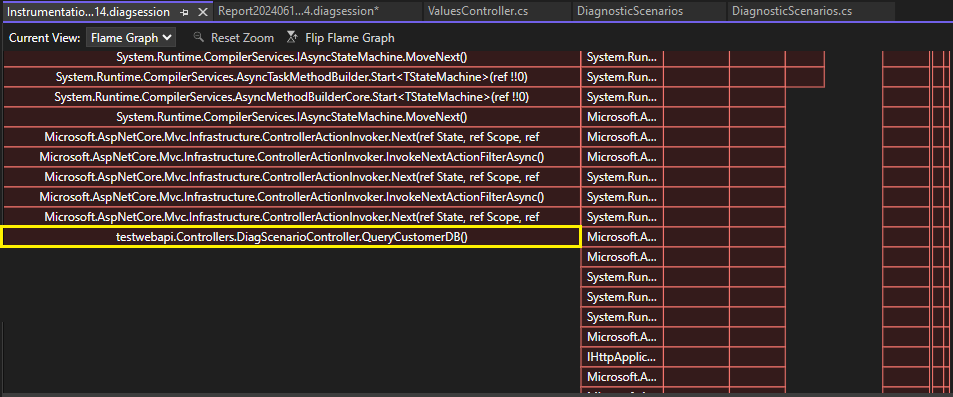
The Flame Graph visualization shows us that the QueryCustomerDB function (shown in yellow) is responsible for a significant portion of the app's running time.
Right-click the QueryCustomerDB function and choose View in Call Tree.

The code path with highest CPU usage in the app is called the hot path. The hot path flame icon (![]() ) can help to quickly identify performance issues that might be improved.
) can help to quickly identify performance issues that might be improved.
In the Call Tree view, you can see that the hot path includes the QueryCustomerDB function, which points to a potential performance issue.
Relative to time spent in other functions, the Self and Avg Self values for the QueryCustomerDB function are very high. Unlike Total and Avg Total, the Self values exclude time spent in other functions, so this is a good place to look for the performance bottleneck.
Tip
If the Self values were relatively low instead of high, you would probably want to look at the actual queries called by the QueryCustomerDB function.
Double-click the QueryCustomerDB function to show the source code for the function.
public ActionResult<string> QueryCustomerDB()
{

    Task dbTask = QueryCustomerFromDbAsync("Dana");
    return "success:tasksleepwait";
}
With a little research, we discover that this code is calling an async API without using await. This is the sync-over-async code pattern, which is a common cause of threadpool starvation, and may block threads.
To resolve, use await.
public async Task<ActionResult<string>> TaskAsyncWait()
{
    Customer c = await PretendQueryCustomerFromDbAsync("Dana");
    return "success:taskasyncwait";
}
If you see performance issues related to database queries, you can use the Database tool to investigate whether certain calls are slower. This data might indicate an opportunity to optimize queries. For a tutorial that shows how to use the Database tool to investigate a performance issue, see Case study: Beginner's guide to optimizing code. The Database tool supports .NET Core with either ADO.NET or Entity Framework Core.
To get visualizations in Visual Studio for individual thread behavior, you can use the Parallel Stacks window while debugging. This window shows individual threads along with information about threads that are waiting, threads they're waiting on, and deadlocks.
For additional information on thread pool starvation, see Detecting threadpool starvation.
Next steps
The following articles and blog posts provide more information to help you learn to use the Visual Studio performance tools effectively.
- Case study: Beginner's guide to optimizing code
- Case Study: Double performance in under 30 minutes
- Improving Visual Studio performance with the new Instrumentation Tool