Enable logs via Diagnostic Settings in Azure Monitor
Overview
Communications Services provides monitoring and analytics features via Azure Monitor Logs overview and Azure Monitor Metrics. Each Azure resource requires its own diagnostic setting, which defines the following criteria:
- Categories of logs and metric data sent to the destinations defined in the setting. The available categories will vary for different resource types.
- One or more destinations to send the logs. Current destinations include Log Analytics workspace, Event Hubs, and Azure Storage.
- A single diagnostic setting can define no more than one of each of the destinations. If you want to send data to more than one of a particular destination type (for example, two different Log Analytics workspaces), then create multiple settings. Each resource can have up to five diagnostic settings.
The following are instructions for configuring your Azure Monitor resource to start creating logs and metrics for your Communications Services. For detailed documentation about using Diagnostic Settings across all Azure resources, see: Diagnostic Settings.
These instructions apply to the following Communications Services logs:
Access Diagnostic Settings
To access Diagnostic Settings for your Communications Services, start by navigating to your Communications Services home page within Azure portal:
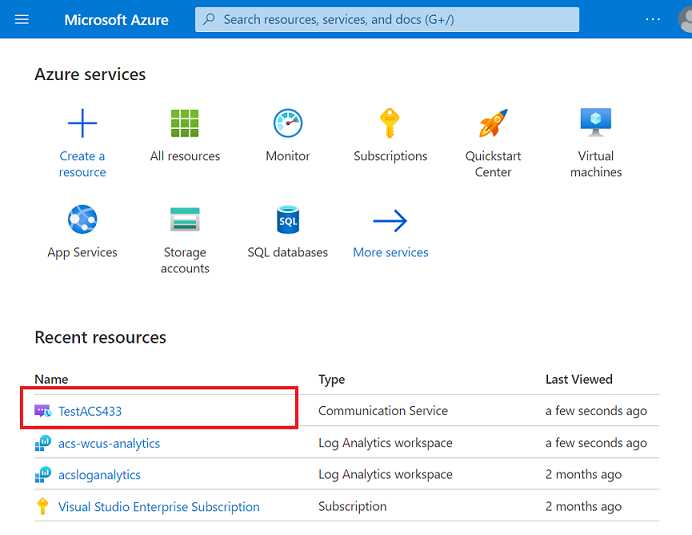
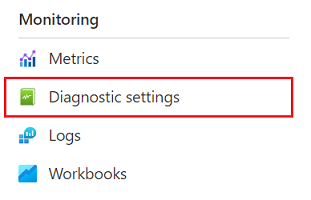
From there, click on "Diagnostic settings" within the Monitoring section of the left-hand navigation pane:
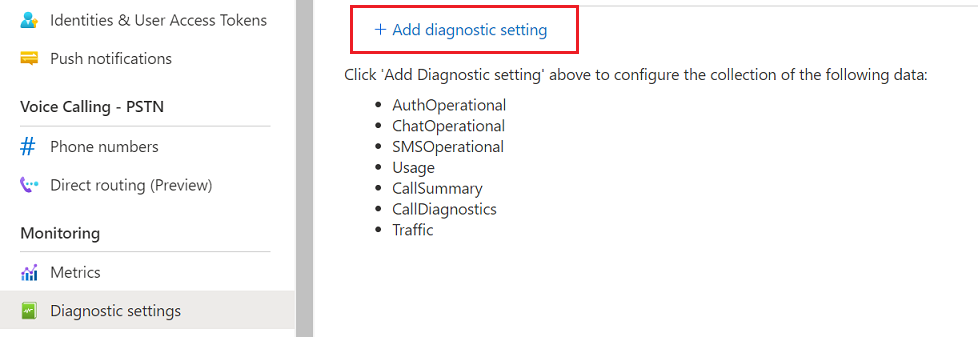
Click on the "Add diagnostic setting" link (note the various logs and metrics sources available for Communications Services):
Adding a Diagnostic Setting
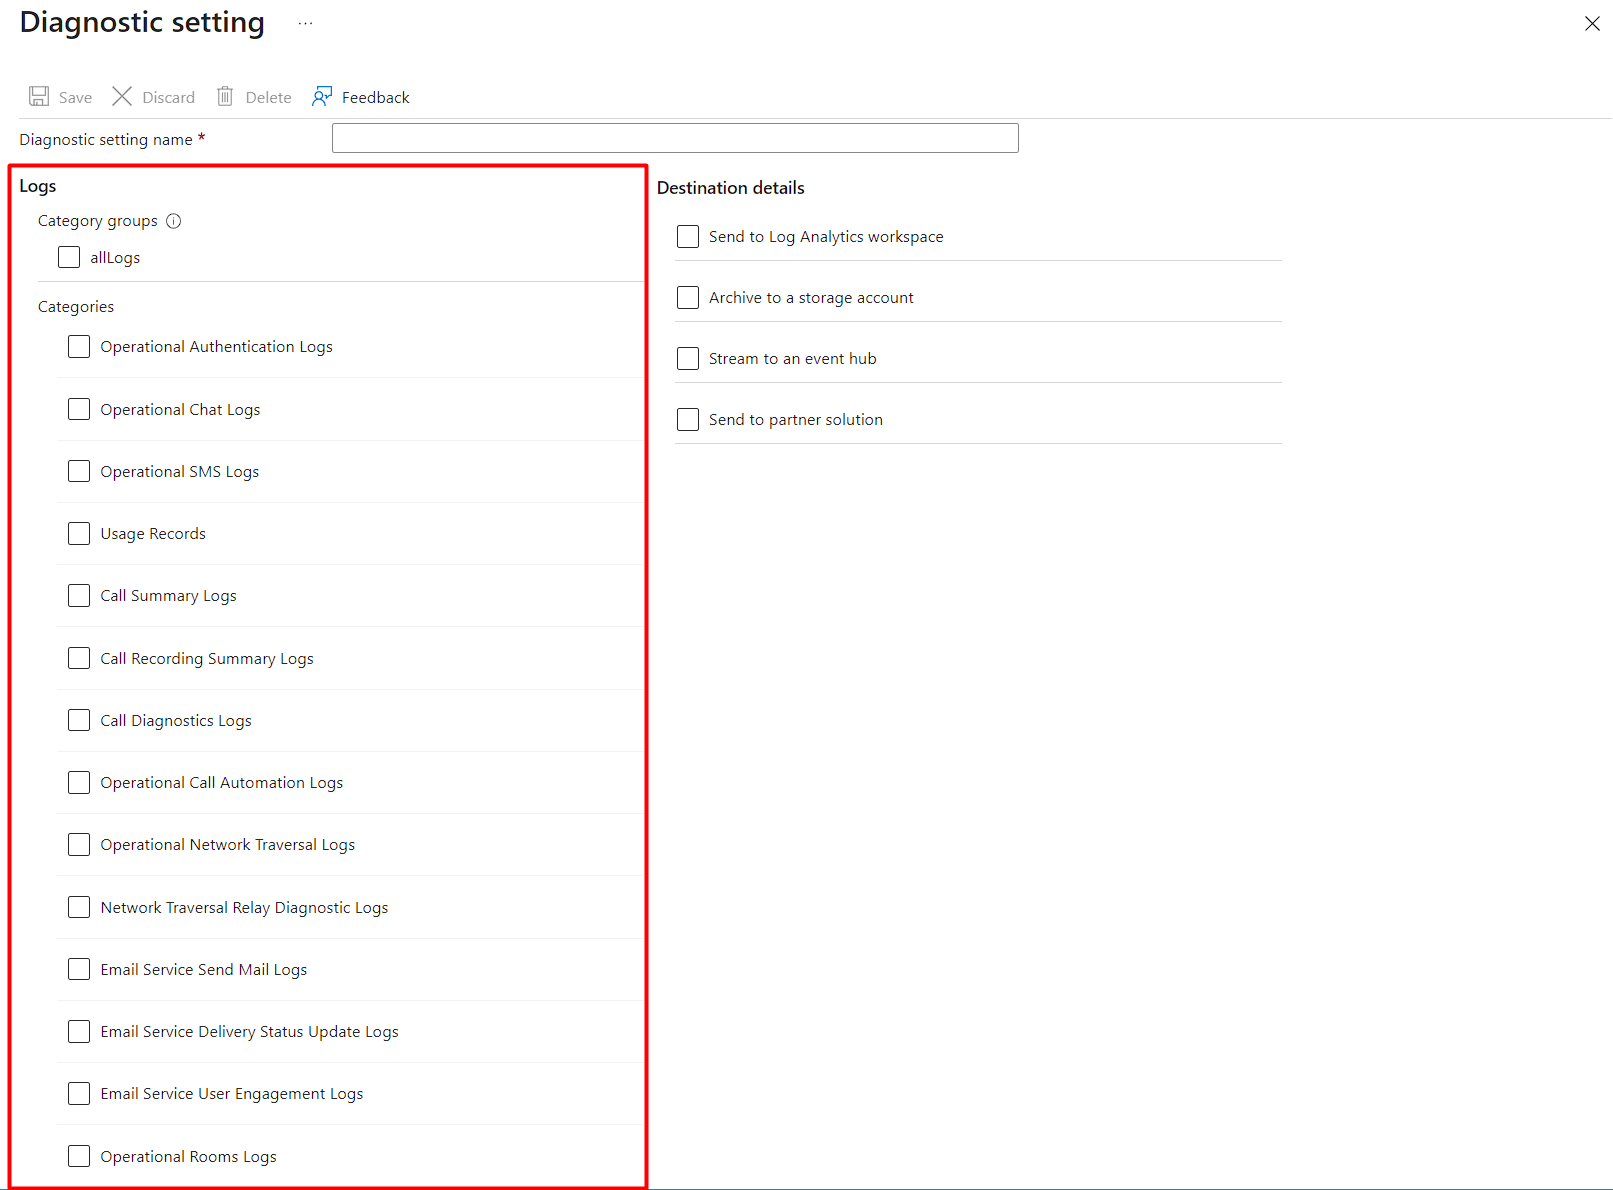
You'll then be prompted to choose a name for your Diagnostic Setting, which is useful if you have many Azure resources you are monitoring. You'll also be prompted to select the log and metric data sources you wish to monitor as either logs or metrics. See Azure Monitor data platform for more detail on the difference.
Choose Destinations
You'll also be prompted to select a destination to store the logs. Platform logs and metrics can be sent to the destinations in the following table, which is also included in Azure Monitor documentation in deeper detail: Create diagnostic settings to send platform logs and metrics to different destinations.
| Destination | Description |
|---|---|
| Log Analytics workspace | Sending logs and metrics to a Log Analytics workspace allows you to analyze them with other monitoring data collected by Azure Monitor using powerful log queries and also to use other Azure Monitor features such as alerts and visualizations. If you don't have a Log Analytics workspace to send your data to, you must create one before you proceed. |
| Event Hubs | Sending logs and metrics to Event Hubs allows you to stream data to external systems such as third-party SIEMs and other log analytics solutions. |
| Azure storage account | Archiving logs and metrics to an Azure storage account is useful for audit, static analysis, or backup. Compared to Azure Monitor Logs and a Log Analytics workspace, Azure storage is less expensive and logs can be kept there indefinitely. |
The following settings are an example of what you would see within your Communications Services resource:
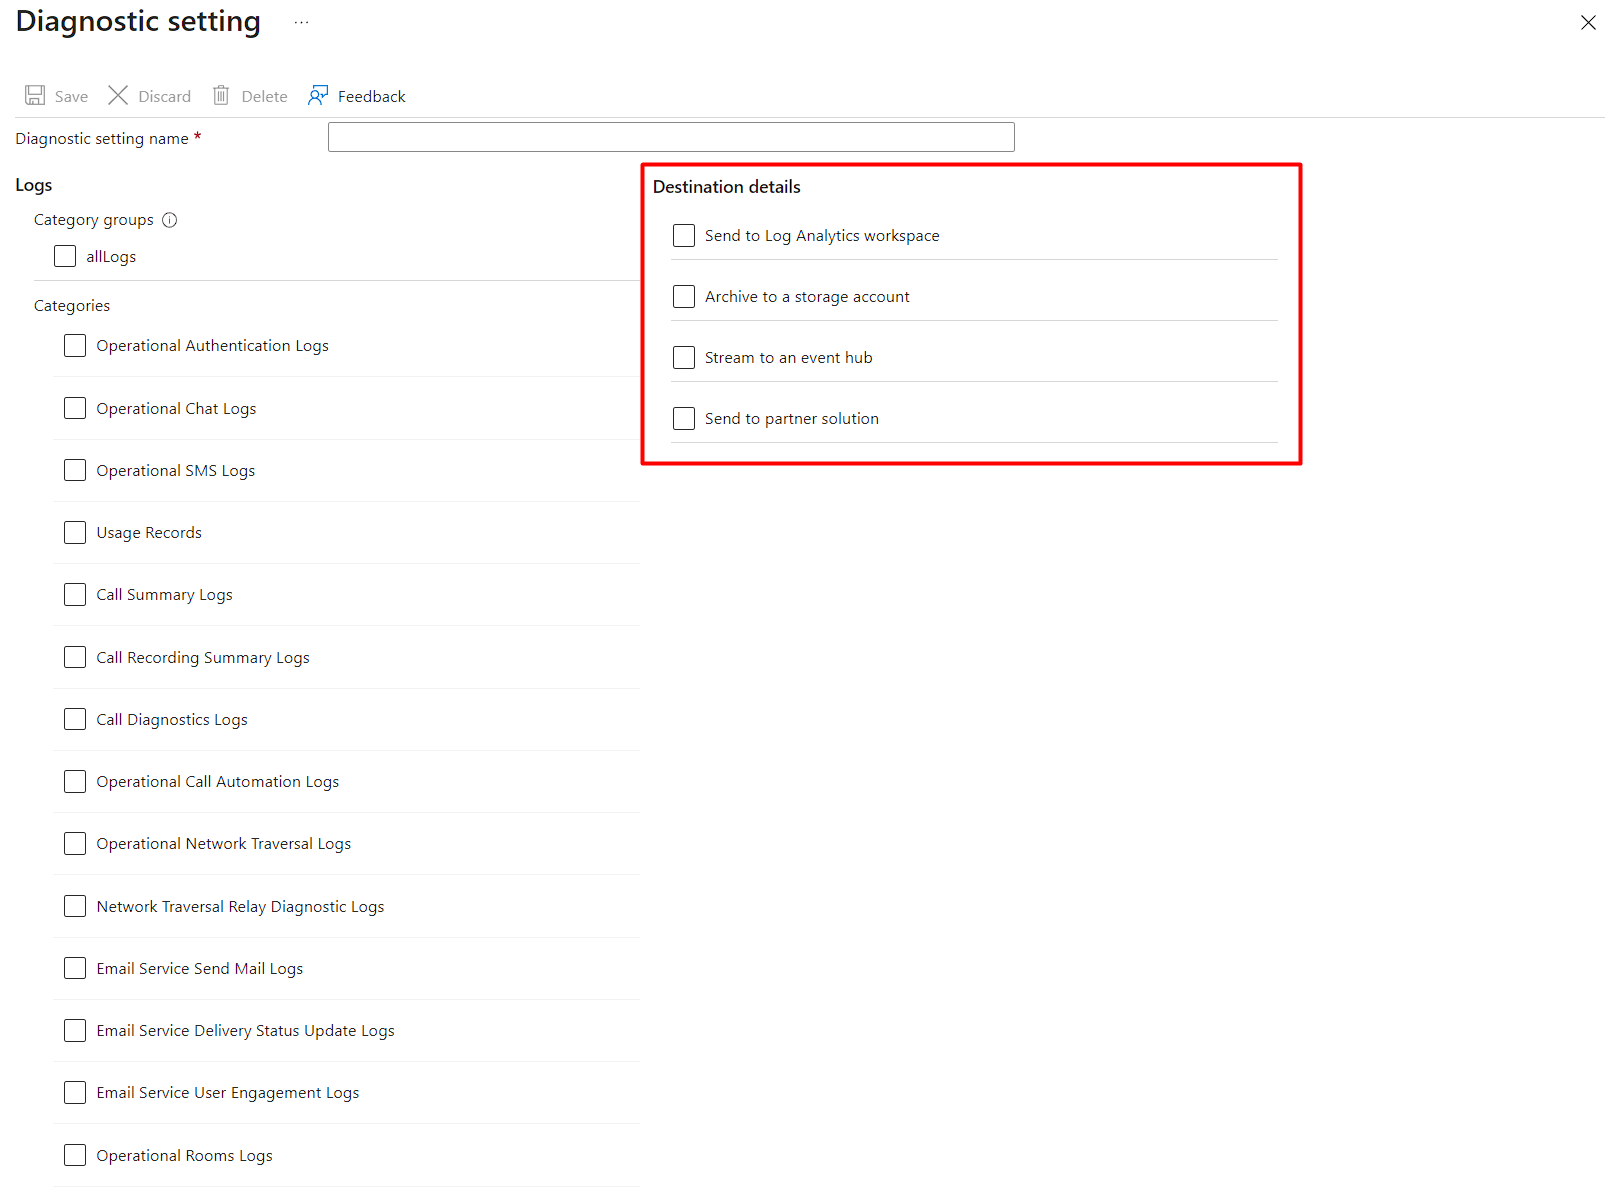
They're all viable and flexible options that can adapt to your specific storage needs; however, we provide other features and built in analytic insights when the Log Analytics Workspace option is selected.
Log Analytics Workspace for additional analytics features
By choosing to send your logs to a Log Analytics workspace destination, you enable more features within Azure Monitor generally and for your Communications Services. Log Analytics is a tool within Azure portal used to create, edit, and run queries with data in your Azure Monitor logs and metrics and Workbooks, alerts, notification actions, REST API access, and many others. If you don't have a Log Analytics workspace, you must create one before you proceed.
For your Communications Services logs, we've provided a useful default query pack to provide an initial set of insights to quickly analyze and understand your data. These query packs are described here: Log Analytics for Communications Services.
Next Steps
If you don't have a Log Analytics workspace to send your data to, you must create one before you proceed. See: Create a Log Analytics workspace
You may start a Diagnostic Setting to use certain capabilities by enabling collection for all logs, however you should monitor costs associated with logs from Diagnostic Settings, see: Controlling costs