Use Frequently bought together model (Preview)
Important
Some or all of this functionality is available as part of a preview release. The content and the functionality are subject to change.
The Frequently bought together solution is composed of a notebook, sample data, Power BI report. The notebook should be executed first to create the output data that is later used by the UI. The notebook uses the sample data by default but you can easily point it to any other Lakehouse with custom data points. For more details, refer: Configure Frequently bought together.
Considerations to use Frequently bought together model notebook
The input tables / entities are expected to be in the delta format. Parquet isn't supported.
Keep the Fabric settings as is (for example, Spark version, Python version).
Input data should be exactly in the same structure as the sample data specified in Input data for Frequently bought together.
Notebook cells and methods should be executed in the same order as presented in the provided notebook.
Input data should be valid. Ensure that all the expected tables and columns exist and are of the correct datatypes as mentioned in Input data for Frequently bought together.
Ensure that tables aren't empty. At least one record should exist for each table and all required fields are populated.
Ensure that there are no duplicate primary keys on the tables.
All primary keys in all tables should be available for any foreign key.
On each notebook execution, previous output tables are wiped, if they already exist in the Lakehouse/path that you provided. You can utilize delta versions.
ID fields present in the output tables (for example, RetailEntityId, ItemsetId and RuleId) are regenerated on each run and aren't necessarily consistent across notebook runs. We recommend that you join the data in the output tables (such as Store, Party and RetailProduct) across different notebooks and use name fields to filter results.
Use Frequently bought together model Power BI report
Frequently bought together model provides a rich set of information and insights on its user interface (UI). The Product Groupings view provides analytics based on the product's Frequently bought together revenue KPI. The Frequently bought together revenue KPI of a product(called a main product), is the sum of the sales revenue from the main product, to which are added the sales revenues of other products bought together with the main product. Each product can be analyzed to calculate its Frequently bought together revenue, and the chart shows only target products as defined by 'Product Criterion' (typically 10 top highest revenues).
By applying three filters, you define the POS data that AI/ML Frequently bought together model analyzes. The filters are:
Retailer or store is identified by POS data. Typical options are, retail-chain, shop 1, shop 2.
Period is identified by the customer in the Frequently bought together model notebook. For example, the period can be related to marketing activities such as new shelf assortment, last month, from 1/1/23 to 6/30/23 and the complementary period would be after the shelf assortment, 7/1/23 to 12/31/23.
Product Criterion extracts the most relevant products set from the POS. A typical product criterion could be 10 highest Frequently bought together revenues, or 10 top selling products Frequently bought together revenues.
Based on these filters, the Frequently bought together model populates a chart and a related table:
The chart shows the revenue of groups of products defined by the Product Criterion, typically ranked by decreasing revenue or unit sold. This revenue is made of two parts:
Sales revenue & the sum of revenues of each Frequently bought together item when bought together with the main item.
Group revenue related to a main item, which is an accurate estimate of the business generated by the said main item.
The default Frequently bought together model on Retail data solutions comes with these sample data and UI settings:
The sample data is from a fictitious retailer, Contoso. It shows nine months of sales in two stores from the same retail chain. The item set has 250 items, the best-sellers in US retail.
A marketing event called 'new shelf assortment' is in the Frequently bought together model notebook. You can see two periods, 'before shelf assortment' and 'after shelf assortment'. You can pick them in the UI Period filter.
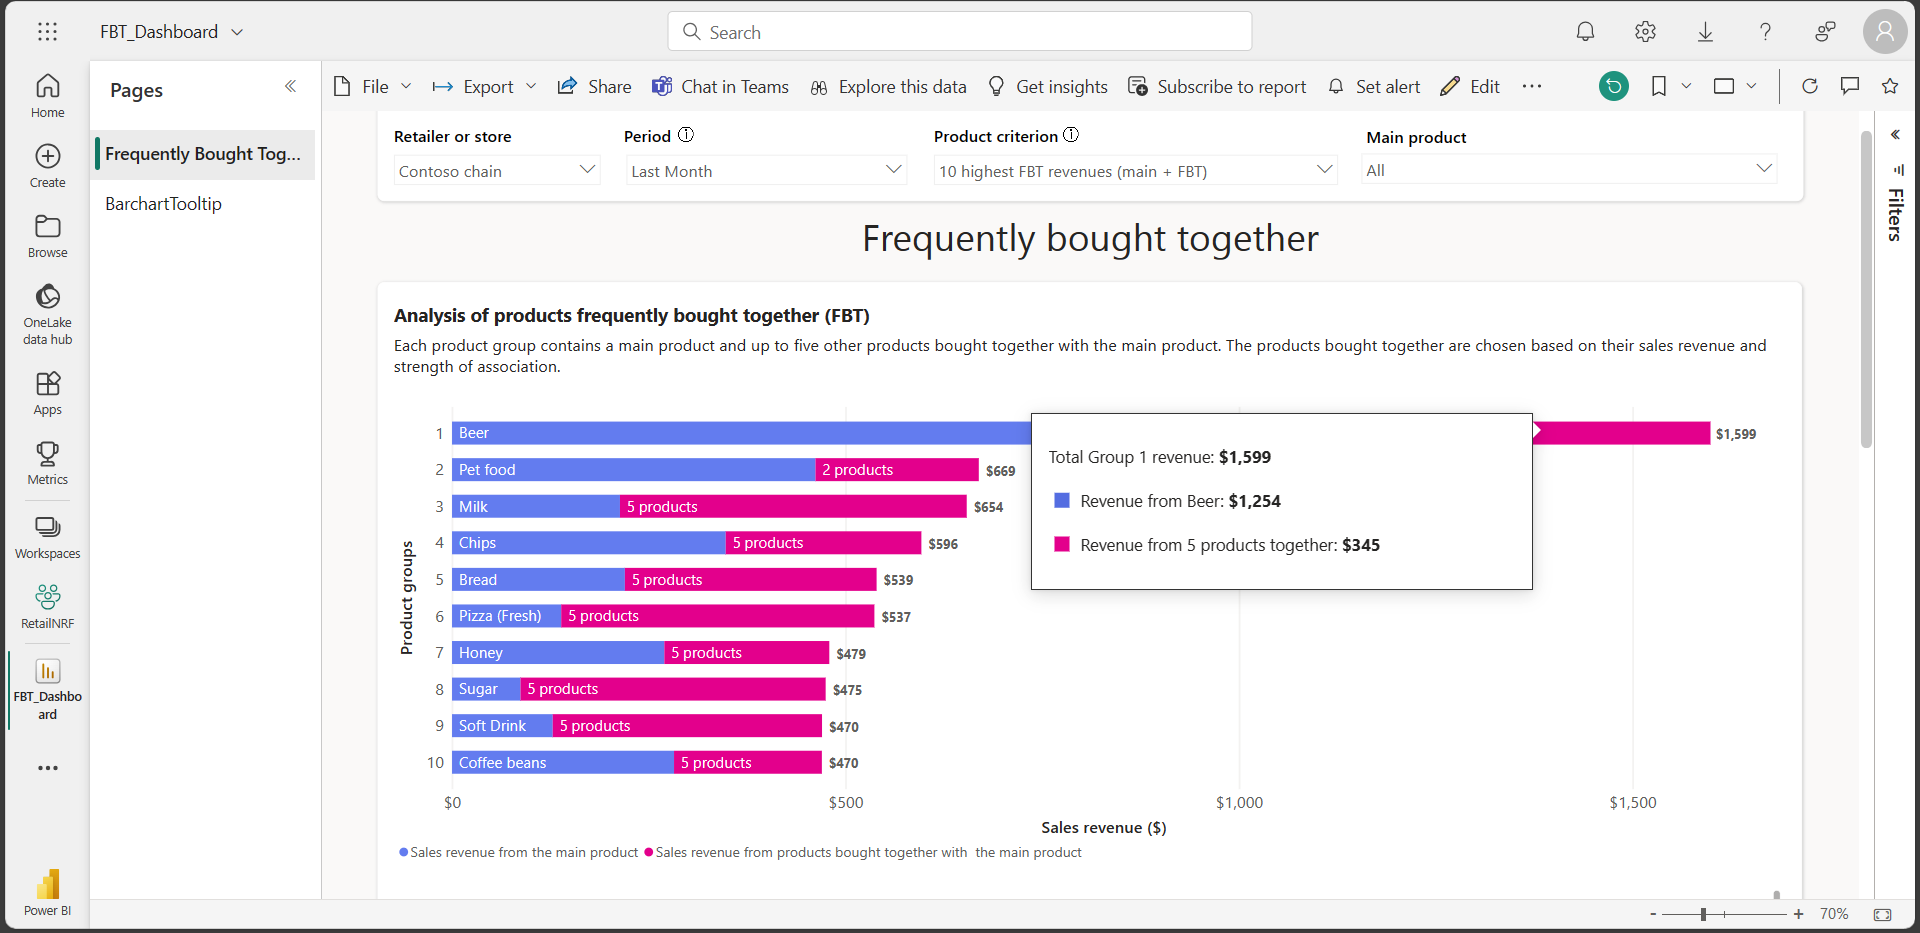
In the chart given, the data shows the 10 highest FBT revenues across all products in the Contoso chain for the last month period. You can hover the mouse over a specific chart item to reveal the details for that product.
In this example, beer is the top revenue-generating product over the last month period with a revenue of $1,254 and a total of $1,599 for the top five products frequently bought together.
The Frequently bought together table allows you to precisely see each element of the group of products - the main item, each Frequently bought together item and relevant data on the revenue & unit sold by each element of the group.
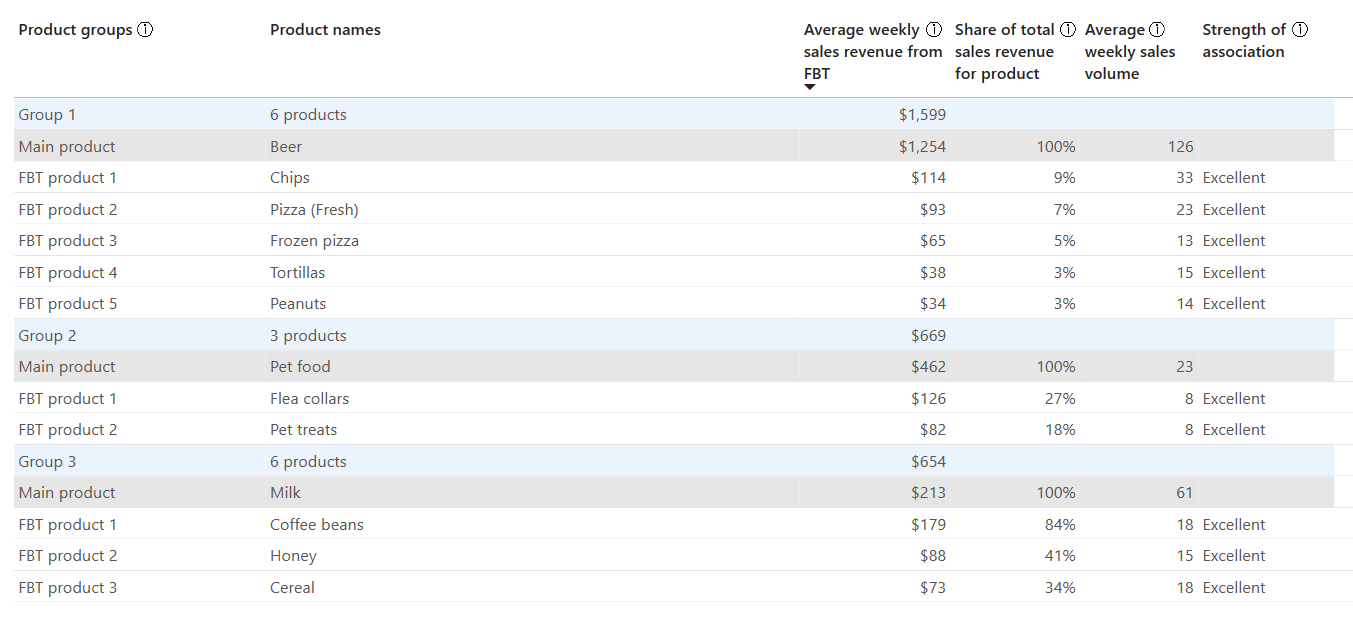
The table given shows the data for the 10 highest Frequently bought together revenues across all products in the Contoso chain for the last month period. The table provides 10 product groups and the top five frequently bought together items within that group along with the _Average weekly sales revenue_from_FBT, Share of total sales revenue, Average weekly sales volume and Strength of association.
For example, beer is the top selling product and heads one of the product groups. The frequently bought together items with beer are Chips, Pizza (Fresh), Frozen pizza, Tortillas and Peanuts. The share of total sales revenue for these items is $114, $93, $65, $38 and $34 respectively.

