Investigate security attacks by using Threat Explorer
In Microsoft Defender for Office 365, there are two subscription plans—Plan 1 and Plan 2. Manually operated Threat hunting tools exist in both plans, under different names and with different capabilities.
Defender for Office 365 Plan 1 uses Real-time detections. This feature is a subset of the Threat Explorer hunting tool in Plan 2. Threat Explorer includes:
- A Real-time detections report that displays detections in real time. Threat Explorer provides this same feature, but it includes extra details for a given attack, such as highlighting attack campaigns. It also gives Security Operations teams the ability to remediate threats. This ability includes triggering an Automated Investigation and Response investigation.
- An All email view. The Real-time detections report doesn't include it.
- Rich filtering capabilities and remediation actions. For more information, see Microsoft Defender for Office 365 Service Description: Feature availability across Defender for Office 365 plans.
Threat Explorer provides a powerful report that enables an organization's Security Operations team to effectively and efficiently investigate and respond to threats. The Threat Dashboard provides C-level executives a broad view of the threat landscape. In contrast, Threat Explorer enables security analysts and admins to drill down and understand details related to threats targeting their tenant.
With Threat Explorer, organizations can:
- See malware detected by Microsoft 365 security features.
- View data about phishing URLs and selection verdict.
- Start an automated investigation and response process from a view in Explorer.
- Preview email header and download email body.
- View Email timeline.
- Export URL selection data.
- Find and investigate malicious email the system previously delivered.
- View malicious files detected in SharePoint Online, OneDrive, and Microsoft Teams.
- Get an overview of the views in Threat Explorer (and real-time detections).
Investigate security attacks using Threat Explorer and Real-time detection views
Threat Explorer and Real-time detections are divided into the following views:
- All email. Shows all email analyzed by Microsoft Defender for Office 365. It contains both good and malicious emails. This feature is only present in Threat Explorer and isn't available for Real-time detections. In fact, it's the default view for Threat Explorer. By default, this view shows data for two days. However, you can expand this time period to 30 days.
- Malware view. Shows emails on which the system identified a malware threat. This view is the default view for Real-time detections, and shows data for two days. You can expand this time period to 30 days.
- Phish view. Shows emails on which the system identified a phish threat.
- Content malware view. Shows malicious detections identified in files shared through OneDrive, SharePoint, or Teams.
The following sections identify the common components within these views.
Filters
You can use the various filters to view the data based on email or file attributes. If you're applying multiple filters, the system applies them in 'AND' mode. You can use the advanced filter to change it to 'OR' mode. You can also use commas to add multiple values for the same filter.
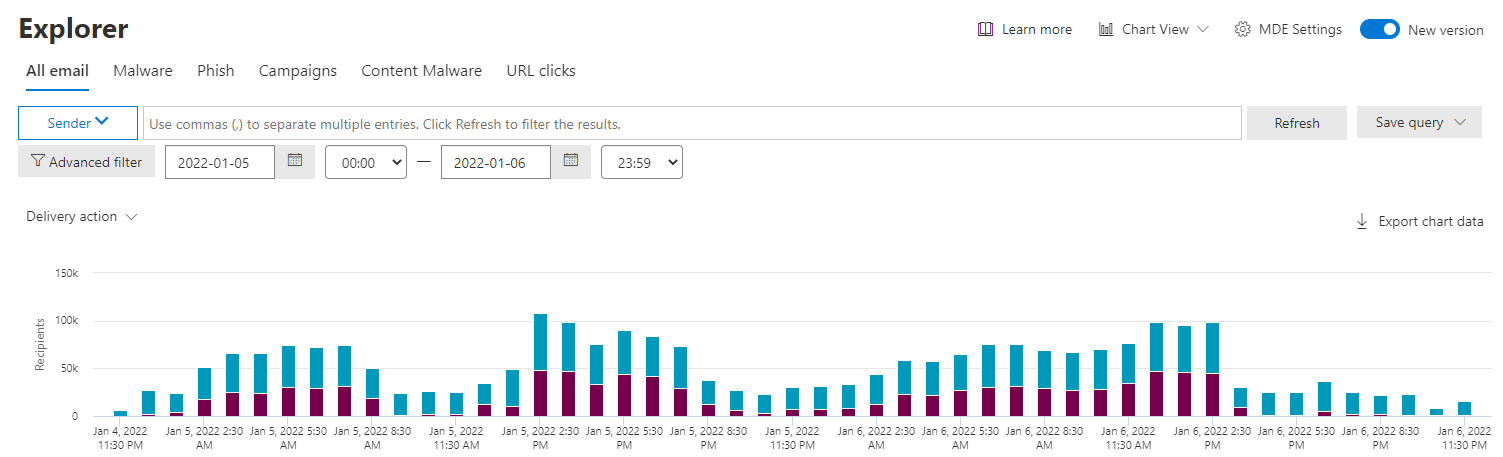
Charts
Charts provide a visual, aggregate view of data based on filters. You can use different filters to view the data by different dimensions.
Note
You may see no results in chart view even if there's an entry in the list view. This situation happens if the filter doesn't produce any data. For example, if you applied the filter malware family, but the underlying data doesn't have any malicious emails. When this situation occurs, you may see the message: No data available for this scenario.
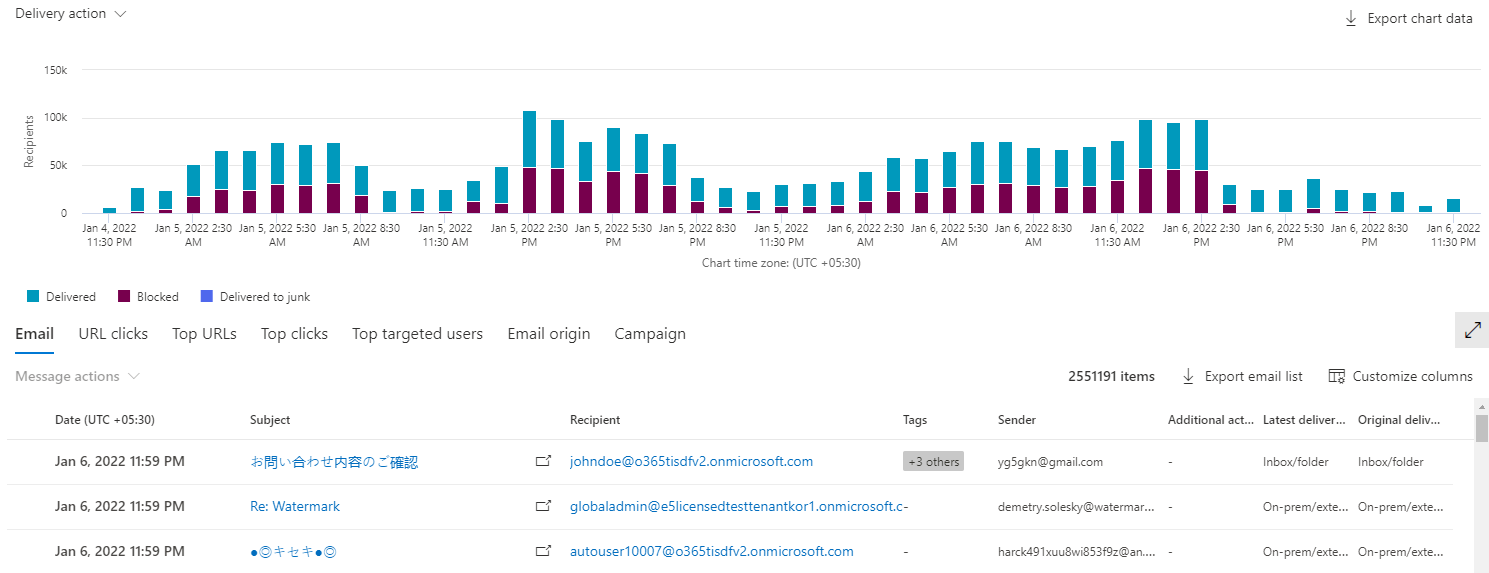
Results grid
Results grid shows the email results based on the filters you applied. Based on the configuration set in your tenant, the results grid shows the data in UTC or local time zone, with the time zone information available in the first column. You can navigate to the individual email entity page from the list view by selecting the Open in new window icon. You can also customize your columns to add or remove columns to optimize your view.
Note
You can toggle between the Chart View and the List View to maximize your result set.
Detailed panes
You can select hyperlinks to get to the Email summary pane (entries in Subject column), Recipient pane, or IP pane. The Email Summary pane provides a path to access the Email Entity pane. The individual entity panes like IP, recipient, and URL reflect the same information, but presented in a single tab-based view. These panes enable you to expand and collapse the different sections based on your organization's requirement. For panes like URLs, you can select View all Email or View all Clicks to view the full set of emails/clicks containing that URL, and export the result set.
Actions
From Threat Explorer, you can trigger remediation actions like Delete an email. For more information on remediation, remediation limits, and tracking remediation, see Remediate malicious email.
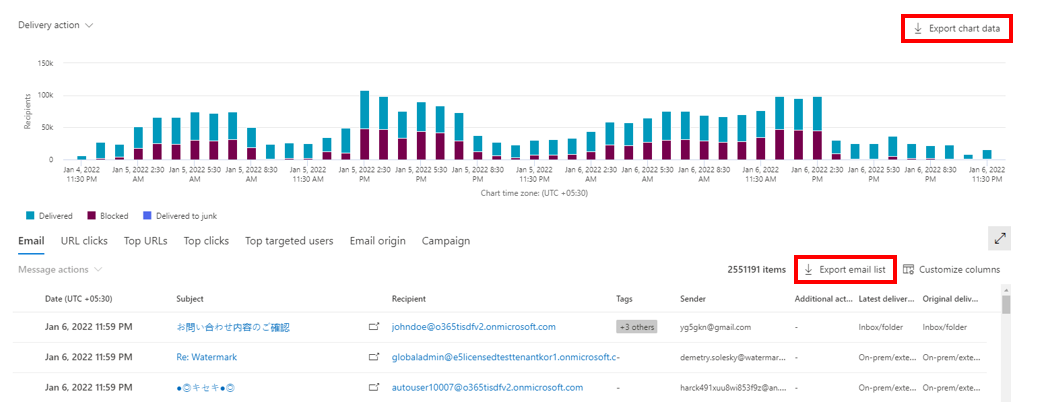
Export
You can select Export chart data to export the chart details. Similarly, select Export email list to export email details. You can export up to 200,000 records for an email list. However, for better system performance and reduced download time, you should use email filters to limit the number of records exported.
Note
In addition to these features, you also get updated experiences like Top URLs, Top clicks, Top targeted users, and Email origin. You can further filter Top URLs, Top clicks, and Top targeted users based on the filter that you apply within Threat Explorer.