Transact-SQL Debugger for SQL Server 2008 – Part 2
This blog will go over what you need to know for setting up your environment for remote debugging along with best practices and other things to consider when using the debugger in SSMS.
This 3 part series covers:
- Basic debugging
- Configure remote debugging & best practices
- Debugging triggers and stored procedures with breakpoints
The debugger consists of 2 components. The server component is installed with the sqlservr.exe. The client component is installed as part of SSMS. When SSMS and the instance you want to debug are on the same system, there is nothing configure. You do however need to login to the instance as a member of the sysadmin role.
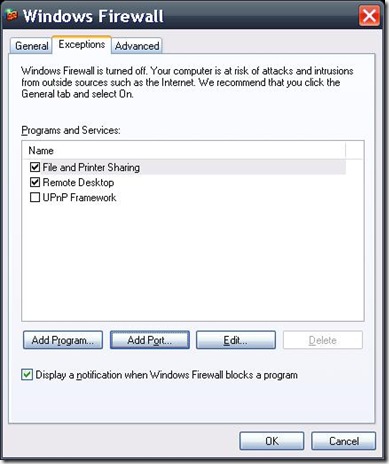
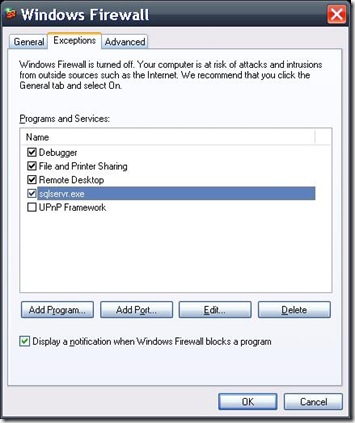
If you need to debug a remote instance, you need to enable the program and port exceptions using the Windows Firewall Control Panel application on both computers.
On the computer that is running the instance of the Database Engine, in Windows Firewall, specify the following information:
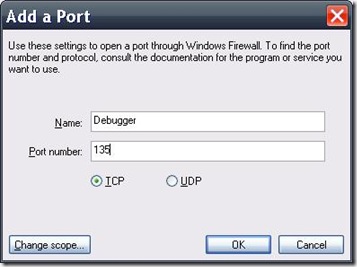
- Add TCP port 135 to the exceptions list.
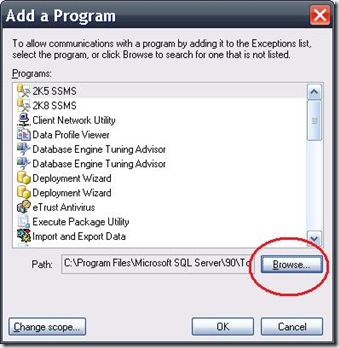
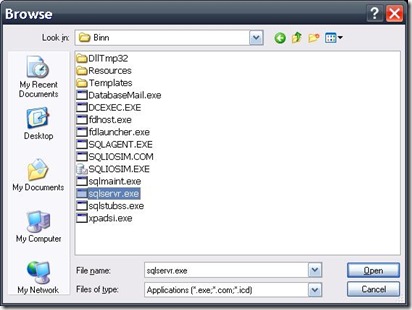
- Add the program sqlservr.exe to the exceptions list. By default, sqlservr.exe is installed in C:\Program Files\Microsoft SQL Server\MSSQL10.InstanceName\MSSQL\Binn, where InstanceName is MSSQLSERVER for the default instance, and the instance name for any named instance.
- If the domain policy requires network communications to be done through IPsec, you must also add UDP port 4500 and UDP port 500 to the exception list.
With the server instance taken care of, you now need to take care of SSMS on the client.
On the computer that is running SQL Server Management Studio, in Windows Firewall, specify the following information:
- Add TCP port 135 to the exceptions list.
- Add program ssms.exe (SQL Server Management Studio) to the exceptions list. By default, ssms.exe is installed in C:\Program Files\Microsoft SQL Server\100\Tools\Binn\VSShell\Common7\IDE.
You are now ready to launch SSMS for remote debugging.
It is highly recommended that Transact-SQL code be debugged on a test server, not a production server, for the following reasons:
- Debugging is a highly privileged operation. Therefore, only members of the sysadmin fixed server role are allowed to debug in SQL Server.
- Debugging sessions often run for long periods of time while you investigate the operations of several Transact-SQL statements. Locks, such as update locks, that are acquired by the session might be held for extended periods, until the session is ended or the transaction committed or rolled back.
That’s it for part 2.
Technorati Tags: SQL Server management Studio,SQL Server 2008,Transact-SQL Debugger
Comments
- Anonymous
April 11, 2009
PingBack from http://blogs.msdn.com/billramo/archive/2009/04/11/transact-sql-debugger-for-sql-server-2008-part-1.aspx - Anonymous
April 12, 2009
Thank you for submitting this cool story - Trackback from DotNetShoutout - Anonymous
April 12, 2009
In part 3 of working with the debugger, I’ll talk about how to set breakpoints and the trick to setting - Anonymous
April 15, 2009
Bill Ramos, a SQL Server Product Manager, has written a three part series on how to use the SQL Server
