How To: Build Sparkline Reports in SQL Server Reporting Services
This is my first post in what I hope is a long series of how to's related to data visualization. For my first post I'm going to demonstrate how you can add sparklines to your SSRS reports.
Below is a screenshot of what a sparkline may look like in SSRS.
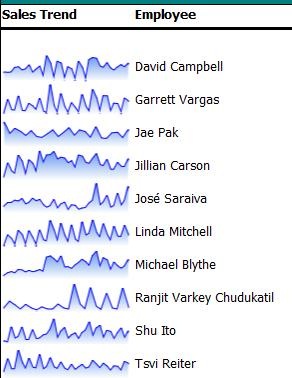
Sparklines are effectively miniature versions of charts used to display trends. In the example above, I've used an area chart, but line charts and column charts are also often used as sparklines and in many cases people will add additional visuals such as conditionally formatting the color of data points.
To implement a sparkline in Reporting Services, simply insert a chart into the body of the report. You probably don't want to start by embedding the chart in the table or matrix right away because you will want to modify the properties of the chart and selection of chart elements works best when the chart is large enough that you can actually select its contents. .
You will also need a dataset. In the example above, I have a query that is retrieving data from the AdventureWorksDW sample database that you can download from Codeplex. The query is:
SELECT T.CalendarYear, T.CalendarQuarter, T.MonthNumberOfYear, SUM(S.ExtendedAmount)as Sales , COALESCE(SUM(Q.SalesAmountQuota )/ COUNT(SalesAmountQuota), SUM(Q.SalesAmountQuota )/ COUNT(SalesAmountQuota)) as Quota , SUM(S.ExtendedAmount) / (SUM(Q.SalesAmountQuota )/ COUNT(SalesAmountQuota)) as Within, E.FirstName + ' ' + E.LastName AS Employee, E.EmployeeKey, 70 as Target FROM FactResellerSales as S LEFT OUTER JOIN dbo.dimTime T ON S.orderdatekey = TimeKey JOIN dbo.DimEmployee E ON S.EmployeeKey = E.EmployeeKey LEFT OUTER JOIN dbo.FactSalesQuota Q on S.EmployeeKey= Q.EmployeeKey AND T.CalendarYear = Q.CalendarYear AND T.CalendarQuarter = Q.CalendarQuarter WHERE S.EmployeeKey in (SELECT TOP 10 EmployeeKey from FactResellerSales GROUP BY factResellerSales.EmployeeKey ORDER BY SUM(ExtendedAmount) DESC) GROUP BY T.CalendarYear ,T.CalendarQuarter,T.MonthNumberOfYear, E.FirstName, E.LastName, E.EmployeeKey ORDER By Employee, T.CalendarYear ASC, T.CalendarQuarter ASC, T.MonthNumberOfYear |
Once the chart is in the body of the report, add the Sales to the Data Fields on the chart and then place the Calendar and Month fields in the category groups.
To finish the look of the sparkline all you need to do is the following:
- Delete the chart title
- Delete the chart legend
- Right click on both the category and value axis and hide them
- Select each axis title and right click and choose the option to hide them
To enable the gradient fill on the area chart do the following:
- Select the series on the chart and bring up it's properties
- On the fill property page, choose fill style = "Gradient"
- For this case, the first color is "Cornflower Blue" and the secondary color is set to "White".
Once you have the look of the sparkline, you can just drag the sparkline into the table or matrix in the appropriate place. The table or matrix will do the job of restricting the rows of the dataset so that each sparkline only shows the data for each row (in this case, each salesperson).
If you have any suggestions for topics on data visualization for Reporting Services, please feel free to leave them in comments.
Comments
Anonymous
October 09, 2008
PingBack from http://www.easycoded.com/how-to-build-sparkline-reports-in-sql-server-reporting-services/Anonymous
October 23, 2008
Sean, The creation of the chart and embedding the chart in the tablix worked fine as described, but when I preview it, I get the following error: [rsInvalidDetailDataGrouping] The chart ‘Chart1’ has a detail member with inner members. Detail members can only contain static inner members. I'm using RS2008/VS2008 by the way. If I remove the grouping on the detail row, the report will render, but of course I lose my grouping. Any ideas? ...and thanks for the post on this topic.Anonymous
October 23, 2008
The comment has been removedAnonymous
October 27, 2008
The comment has been removedAnonymous
October 28, 2008
The new charting features are great. This one in particular is very useful for us. Thanks!Anonymous
October 28, 2008
My colleagues Sean Boon and Alex Gorev recently started their own blogs with focus on data visualization.Anonymous
November 14, 2011
Very useful post! I had to use two data points and apply conditional formatting. Documented it <a href="svangasql.wordpress.com/.../a>Anonymous
January 21, 2012
I am using sparkings on a column of data that has nulls The default behaviour shows the nulls as zeros . How can I show the chart with a gap for nulls?Anonymous
January 21, 2012
figured it out. I was returning 0 in my function, changed it to system.dbnull