Notitie
Voor toegang tot deze pagina is autorisatie vereist. U kunt proberen u aan te melden of de directory te wijzigen.
Voor toegang tot deze pagina is autorisatie vereist. U kunt proberen de mappen te wijzigen.
Dit artikel bevat codefragmenten die laten zien hoe je het Microsoft Sentinel Data Lake kunt doorzoeken met behulp van Jupyter notebooks. De voorbeelden bestrijken gegevens uit tabellen zoals Microsoft Entra ID inloglogs, groepsdetails en apparaatnetwerkgebeurtenissen. Elk fragment is ontworpen om te draaien in een Jupyter-notebook in Visual Studio Code met de Microsoft Sentinel-extensie.
Om deze voorbeelden uit te voeren, moet je de vereiste rechten en Visual Studio Code hebben geïnstalleerd met de Microsoft Sentinel-extensie. Zie voor meer informatie machtigingen voor de Microsoft Sentinel-data lake en Jupyter-notebooks gebruiken met de Microsoft Sentinel-data lake.
Analyse van mislukte aanmeldingspogingen
In dit voorbeeld worden gebruikers met mislukte aanmeldpogingen geïdentificeerd. Om deze gebruikers te vinden, verwerkt het notebook aanmeldgegevens uit twee tabellen:
- SigninLogs
- AADNonInteractiveUserSignInLogs
Het notebook voert de volgende stappen uit:
- Maak een functie voor het verwerken van gegevens uit de opgegeven tabellen, waaronder:
- Laad gegevens uit de opgegeven tabellen in DataFrames.
- Parseert het JSON-veld Status om 'errorCode' te extraheren en te bepalen of elke aanmeldingspoging is geslaagd of mislukt.
- Aggreg de gegevens om het aantal mislukte en geslaagde aanmeldingspogingen voor elke gebruiker te tellen.
- Filter de gegevens zodat alleen gebruikers met meer dan 100 mislukte aanmeldingspogingen en ten minste één geslaagde aanmeldingspoging worden opgenomen.
- Rangschik de resultaten op het aantal mislukte aanmeldingspogingen.
- Roep de functie aan voor zowel de tabellen
SigninLogsalsAADNonInteractiveUserSignInLogs. - Combineer de resultaten van beide tabellen in één DataFrame.
- Converteer het DataFrame naar een Pandas DataFrame.
- Filter het Pandas DataFrame om de top 20 gebruikers weer te geven met het hoogste aantal mislukte aanmeldingspogingen.
- Maak een staafdiagram om de gebruikers met het hoogste aantal mislukte aanmeldingspogingen te visualiseren.
Opmerking
Het duurt ongeveer 10 minuten om dit notebook uit te voeren op de grote pool, afhankelijk van de hoeveelheid gegevens in de logboektabellen
# Import necessary libraries
import matplotlib.pyplot as plt
from sentinel_lake.providers import MicrosoftSentinelProvider
from pyspark.sql.functions import col, when, count, from_json, desc
from pyspark.sql.types import StructType, StructField, StringType

data_provider = MicrosoftSentinelProvider(spark)

# Function to process data
def process_data(table_name,workspace_name):
    # Load data into DataFrame
    df = data_provider.read_table(table_name, workspace_name)

    # Define schema for parsing the 'Status' JSON field
    status_schema = StructType([StructField("errorCode", StringType(), True)])
    # Parse the 'Status' JSON field to extract 'errorCode'
    df = df.withColumn("Status_json", from_json(col("Status"), status_schema)) \
           .withColumn("ResultType", col("Status_json.errorCode"))
    # Define success codes
    success_codes = ["0", "50125", "50140", "70043", "70044"]

    # Determine FailureOrSuccess based on ResultType
    df = df.withColumn("FailureOrSuccess", when(col("ResultType").isin(success_codes), "Success").otherwise("Failure"))

    # Summarize FailureCount and SuccessCount
    df = df.groupBy("UserPrincipalName", "UserDisplayName", "IPAddress") \
           .agg(count(when(col("FailureOrSuccess") == "Failure", True)).alias("FailureCount"),
                count(when(col("FailureOrSuccess") == "Success", True)).alias("SuccessCount"))

    # Filter where FailureCount > 100 and SuccessCount > 0
    df = df.filter((col("FailureCount") > 100) & (col("SuccessCount") > 0))

    # Order by FailureCount descending
    df = df.orderBy(desc("FailureCount"))

    return df

# Process the tables to a common schema
workspace_name = "your-workspace-name"  # Replace with your actual workspace name
aad_signin = process_data("SigninLogs", workspace_name)
aad_non_int = process_data("AADNonInteractiveUserSignInLogs", workspace_name)

# Union the DataFrames
result_df = aad_signin.unionByName(aad_non_int)

# Show the result
result_df.show()

# Convert the Spark DataFrame to a Pandas DataFrame
result_pd_df = result_df.toPandas()

# Filter to show table with top 20 users with the highest failed sign-ins attempted
top_20_df = result_pd_df.nlargest(20, 'FailureCount')

# Create bar chart to show users by highest failed sign-ins attempted
plt.figure(figsize=(12, 6))
plt.bar(top_20_df['UserDisplayName'], top_20_df['FailureCount'], color='skyblue')
plt.xlabel('Users')
plt.ylabel('Number of Failed sign-ins')
plt.title('Top 20 Users with Failed sign-ins')
plt.xticks(rotation=45, ha='right')
plt.tight_layout()
plt.show()
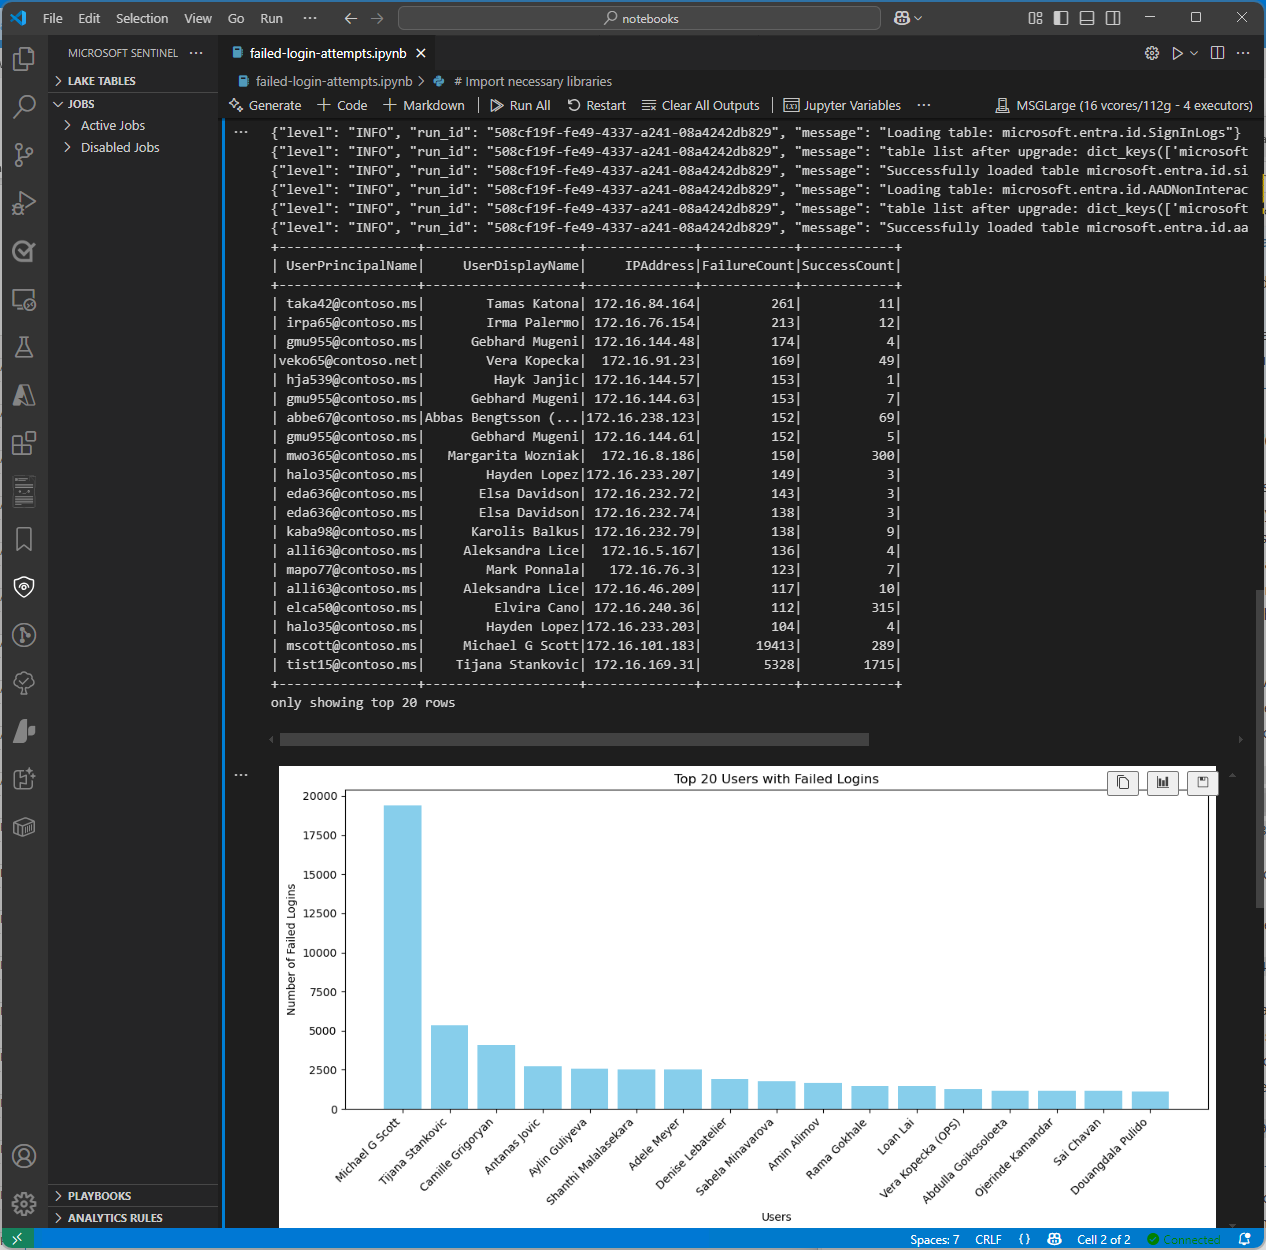
In de volgende schermopname ziet u voorbeelduitvoer van het voorbeeld van een mislukte aanmeldingsanalyse, waarin de top 20 gebruikers met het hoogste aantal mislukte aanmeldingspogingen in een staafdiagramindeling worden weergegeven.
Query's uitvoeren op de tabel EntraGroups
Dit voorbeeld leest de EntraGroups tabel uit. Het geeft groepsgegevens terug zoals naam, type, e-mail en huurder-ID.
from sentinel_lake.providers import MicrosoftSentinelProvider
data_provider = MicrosoftSentinelProvider(spark)

table_name = "EntraGroups"
df = data_provider.read_table(table_name)
df.select("displayName", "groupTypes", "mail", "mailNickname", "description", "tenantId").show(100, truncate=False)
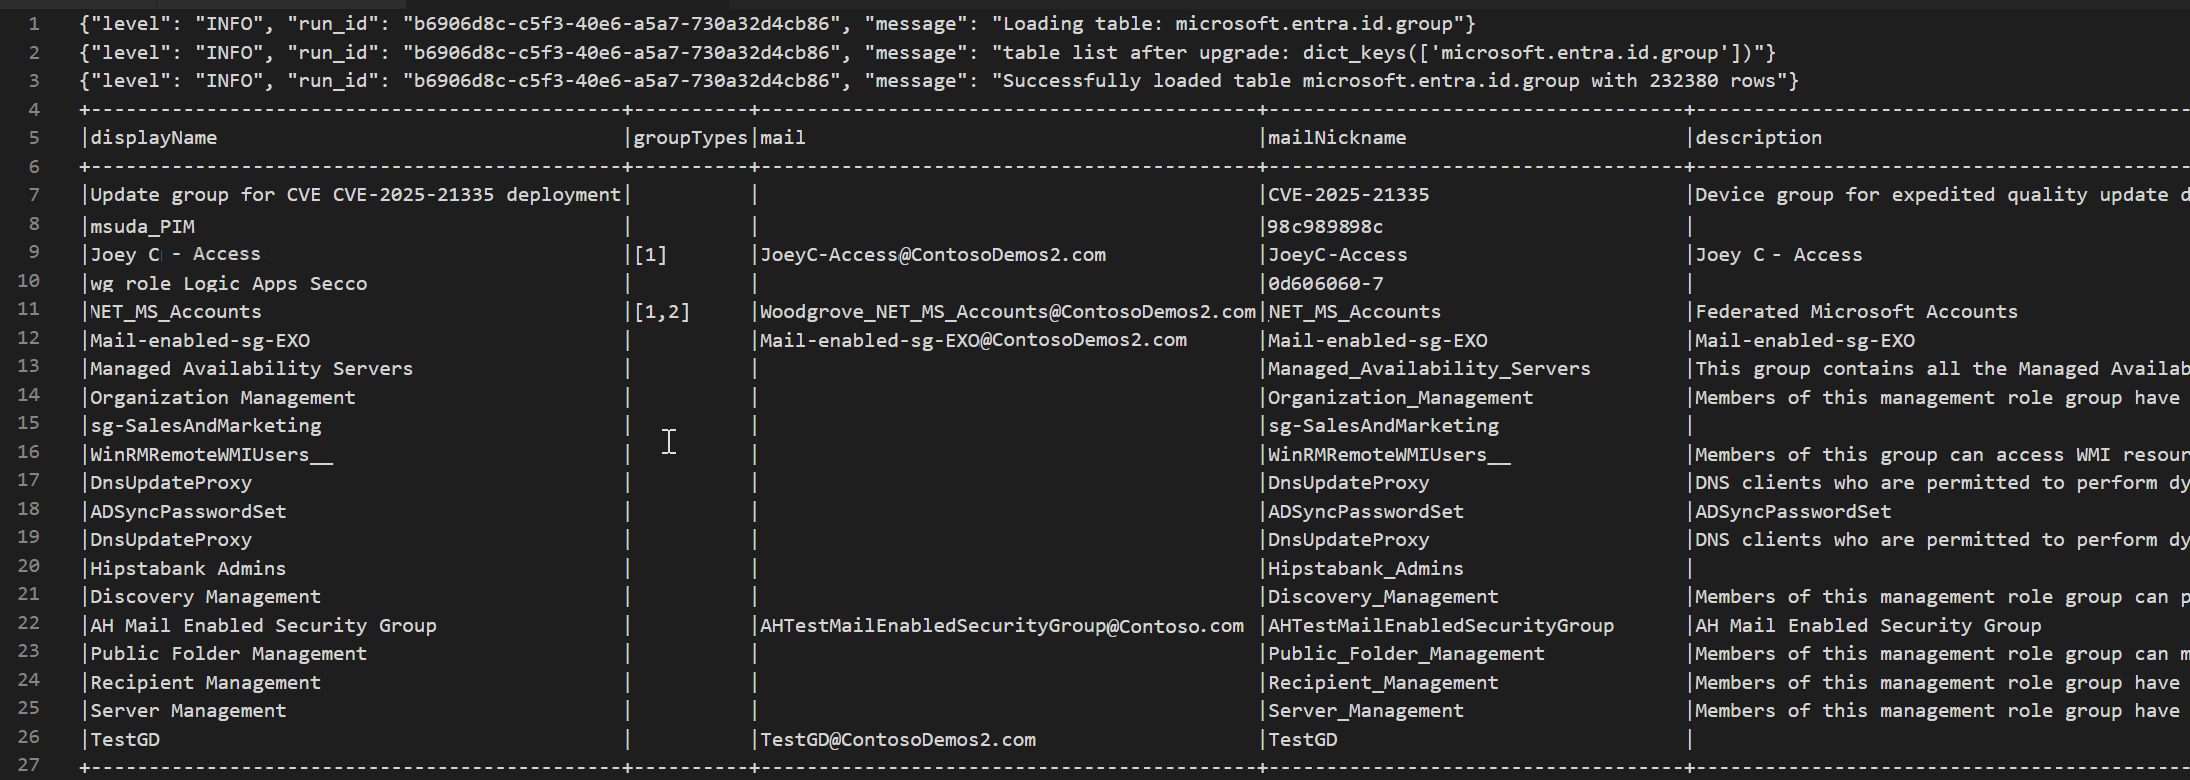
In de volgende schermopname ziet u voorbeelduitvoer van het voorbeeld van de entraGroups-tabelquerycode, waarin de Microsoft Entra ID groepsinformatie in een dataframe-indeling wordt weergegeven.
Toegang tot Microsoft Entra ID aanmeldingslogboeken voor een specifieke gebruiker
Dit voorbeeld bevraagt de SigninLogs tabel en filtert de resultaten voor een specifieke gebruiker. Het levert velden als UserDisplayName, UserPrincipalName en UserId terug.
from sentinel_lake.providers import MicrosoftSentinelProvider
data_provider = MicrosoftSentinelProvider(spark)

table_name = "SigninLogs"
workspace_name = "your-workspace-name"  # Replace with your actual workspace name
df = data_provider.read_table(table_name, workspace_name)
df.select("UserDisplayName", "UserPrincipalName", "UserId", "CorrelationId", "UserType",
 "ResourceTenantId", "RiskLevelDuringSignIn", "ResourceProvider", "IPAddress", "AppId", "AADTenantId")\
    .filter(df.UserPrincipalName == "bploni5@contoso.com")\
    .show(100, truncate=False)
Aanmeldingslocaties onderzoeken
In het volgende codevoorbeeld ziet u hoe u aanmeldingslocaties uit de tabel Microsoft Entra ID SigninLogs kunt extraheren en weergeven. De functie wordt gebruikt from_json om de JSON-structuur van het LocationDetails veld te parseren, zodat u toegang hebt tot specifieke locatiekenmerken, zoals plaats, provincie en land of regio.
from sentinel_lake.providers import MicrosoftSentinelProvider
from pyspark.sql.functions import from_json, col
from pyspark.sql.types import StructType, StructField, StringType

data_provider = MicrosoftSentinelProvider(spark)
workspace_name = "your-workspace-name"  # Replace with your actual workspace name
table_name = "SigninLogs"
df = data_provider.read_table(table_name, workspace_name)

location_schema = StructType([
  StructField("city", StringType(), True),
  StructField("state", StringType(), True),
  StructField("countryOrRegion", StringType(), True)
])

# Extract location details from JSON
df = df.withColumn("LocationDetails", from_json(col("LocationDetails"), location_schema))
df = df.select("UserPrincipalName", "CreatedDateTime", "IPAddress",
 "LocationDetails.city", "LocationDetails.state", "LocationDetails.countryOrRegion")

sign_in_locations_df = df.orderBy("CreatedDateTime", ascending=False)
sign_in_locations_df.show(100, truncate=False)
Aanmeldingen uit ongebruikelijke landen
In het volgende codevoorbeeld ziet u hoe u aanmeldingen kunt identificeren uit landen die geen deel uitmaken van het typische aanmeldingspatroon van een gebruiker.
from sentinel_lake.providers import MicrosoftSentinelProvider
from pyspark.sql.functions import from_json, col
from pyspark.sql.types import StructType, StructField, StringType

data_provider = MicrosoftSentinelProvider(spark)
table_name = "signinlogs"
workspace_name = "your-workspace-name"  # Replace with your actual workspace name
df = data_provider.read_table(table_name, workspace_name)

location_schema = StructType([
    StructField("city", StringType(), True),
    StructField("state", StringType(), True),
    StructField("countryOrRegion", StringType(), True)
])

# Extract location details from JSON
df = df.withColumn("LocationDetails", from_json(col("LocationDetails"), location_schema))
df = df.select(
    "UserPrincipalName",
    "CreatedDateTime",
    "IPAddress",
    "LocationDetails.city",
    "LocationDetails.state",
    "LocationDetails.countryOrRegion"
)

sign_in_locations_df = df.orderBy("CreatedDateTime", ascending=False)
sign_in_locations_df.show(100, truncate=False)
Brute force-aanval door meerdere mislukte aanmeldpogingen
Identificeer mogelijke brute force-aanvallen door aanmeldingslogboeken van gebruikers te analyseren voor accounts met een groot aantal mislukte aanmeldingspogingen.
from sentinel_lake.providers import MicrosoftSentinelProvider
from pyspark.sql.functions import col, when, count, from_json, desc
from pyspark.sql.types import StructType, StructField, StringType

data_provider = MicrosoftSentinelProvider(spark)

def process_data(table_name, workspace_name):
    df = data_provider.read_table(table_name, workspace_name)
    status_schema = StructType([StructField("errorCode", StringType(), True)])
    df = df.withColumn("Status_json", from_json(col("Status"), status_schema)) \
           .withColumn("ResultType", col("Status_json.errorCode"))
    success_codes = ["0", "50125", "50140", "70043", "70044"]
    df = df.withColumn("FailureOrSuccess", when(col("ResultType").isin(success_codes), "Success").otherwise("Failure"))
    df = df.groupBy("UserPrincipalName", "UserDisplayName", "IPAddress") \
           .agg(count(when(col("FailureOrSuccess") == "Failure", True)).alias("FailureCount"),
                count(when(col("FailureOrSuccess") == "Success", True)).alias("SuccessCount"))
    # Lower the brute force threshold to >10 failures and remove the success requirement
    df = df.filter(col("FailureCount") > 10)
    df = df.orderBy(desc("FailureCount"))
    df = df.withColumn("AccountCustomEntity", col("UserPrincipalName")) \
           .withColumn("IPCustomEntity", col("IPAddress"))
    return df
workspace_name = "your-workspace-name"  # Replace with your actual workspace name
aad_signin = process_data("SigninLogs", workspace_name)
aad_non_int = process_data("AADNonInteractiveUserSignInLogs",workspace_name)
result_df = aad_signin.unionByName(aad_non_int)
result_df.show()
Laterale verplaatsingspogingen detecteren
Gebruik DeviceNetworkEvents om interne-naar-interne verbindingen met een hoog aantal verbindingen te vinden, wat kan wijzen op laterale beweging. Je kunt de drempel voor het aantal verbindingen aanpassen of poortfilters toevoegen om de resultaten te beperken tot specifieke protocollen.
from sentinel_lake.providers import MicrosoftSentinelProvider
from pyspark.sql.functions import col, count, countDistinct, desc

deviceNetworkEventTable = "DeviceNetworkEvents"
workspace_name = "<your-workspace-name>"  # Replace with your actual workspace name
data_provider = MicrosoftSentinelProvider(spark)
device_network_events = data_provider.read_table(deviceNetworkEventTable, workspace_name)

# Define internal IP address range (example: 10.x.x.x, 192.168.x.x, 172.16.x.x - 172.31.x.x)
internal_ip_regex = r"^(10\.\d{1,3}\.\d{1,3}\.\d{1,3}|192\.168\.\d{1,3}\.\d{1,3}|172\.(1[6-9]|2[0-9]|3[0-1])\.\d{1,3}\.\d{1,3})$"

# Filter for internal-to-internal connections
internal_connections = device_network_events.filter(
    col("RemoteIP").rlike(internal_ip_regex) &
    col("LocalIP").rlike(internal_ip_regex)
)

# Group by source and destination, count connections
suspicious_lateral = (
    internal_connections.groupBy("LocalIP", "RemoteIP", "InitiatingProcessAccountName")
    .agg(count("*").alias("ConnectionCount"))
    .filter(col("ConnectionCount") > 10)  # Threshold can be adjusted
    .orderBy(desc("ConnectionCount"))
)
suspicious_lateral.show()
Hulpprogramma's voor referentiedumping ontdekken
Zoek DeviceProcessEvents op om bekende credential-dumpingtools of verdachte processen te vinden die met lsass.exeinterageren, wat kan wijzen op credential harvesting.
from sentinel_lake.providers import MicrosoftSentinelProvider
from pyspark.sql.functions import col, lower

workspace_id = "<your-workspace-name>"
device_process_table = "DeviceProcessEvents"

data_provider = MicrosoftSentinelProvider(spark)
process_events = data_provider.read_table(device_process_table, workspace_id)

# Look for known credential dumping tools and suspicious access to lsass.exe
suspicious_processes = process_events.filter(
    (lower(col("FileName")).rlike("mimikatz|procdump|lsassy|nanodump|sekurlsa|dumpert")) |
    (
        (lower(col("FileName")) == "lsass.exe") &
        (~lower(col("InitiatingProcessFileName")).isin(["services.exe", "wininit.exe", "taskmgr.exe"]))
    )
)

suspicious_processes.select(
    "Timestamp",
    "DeviceName",
    "AccountName",
    "FileName",
    "FolderPath",
    "InitiatingProcessFileName",
    "InitiatingProcessCommandLine"
).show(50, truncate=False)
Correlatie van USB-activiteit met gevoelige bestandstoegang
Combineer DeviceEvents en DeviceFileEvents in een notebook om potentiële gegevensexfiltratiepatronen weer te geven. Voeg visualisaties toe om te laten zien welke apparaten, gebruikers of bestanden betrokken waren en wanneer.
from sentinel_lake.providers import MicrosoftSentinelProvider
from pyspark.sql.functions import col, lower, to_timestamp, expr
import matplotlib.pyplot as plt

data_provider = MicrosoftSentinelProvider(spark)
workspace_id = “<your-workspace-id>”

# Load DeviceEvents and DeviceFileEvents tables
device_events = data_provider.read_table("DeviceEvents", workspace_id)
device_file_events = data_provider.read_table("DeviceFileEvents", workspace_id)
device_info = data_provider.read_table("DeviceInfo", workspace_id)

# Filter for USB device activity (adjust 'ActionType' or 'AdditionalFields' as needed)
usb_events = device_events.filter(
    lower(col("ActionType")).rlike("usb|removable|storage")
)

# Filter for sensitive file access (e.g., files in Documents, Desktop, or with sensitive extensions)
sensitive_file_events = device_file_events.filter(
    lower(col("FolderPath")).rlike("documents|desktop|finance|confidential|secret|sensitive") |
    lower(col("FileName")).rlike(r"\.(docx|xlsx|pdf|csv|zip|7z|rar|pst|bak)$")
)

# Convert timestamps
usb_events = usb_events.withColumn("EventTime", to_timestamp(col("Timestamp")))
sensitive_file_events = sensitive_file_events.withColumn("FileEventTime", to_timestamp(col("Timestamp")))

# Join on DeviceId and time proximity (within 10 minutes) using expr for column operations
joined = usb_events.join(
    sensitive_file_events,
    (usb_events.DeviceId == sensitive_file_events.DeviceId) &
    (expr("abs(unix_timestamp(EventTime) - unix_timestamp(FileEventTime)) <= 600")),
    "inner"
) \
.join(device_info, usb_events.DeviceId == device_info.DeviceId, "inner")


# Select relevant columns
correlated = joined.select(
    device_info.DeviceName,
    usb_events.DeviceId,
    usb_events.AccountName,
    usb_events.EventTime.alias("USBEventTime"),
    sensitive_file_events.FileName,
    sensitive_file_events.FolderPath,
    sensitive_file_events.FileEventTime
)

correlated.show(50, truncate=False)

# Visualization: Number of sensitive file accesses per device
pd_df = correlated.toPandas()
if not pd_df.empty:
    plt.figure(figsize=(12, 6))
    pd_df.groupby('DeviceName').size().sort_values(ascending=False).head(10).plot(kind='bar')
    plt.title('Top Devices with Correlated USB and Sensitive File Access Events')
    plt.xlabel('DeviceName')
    plt.ylabel('Number of Events')
    plt.tight_layout()
    plt.show()
else:
    print("No correlated USB and sensitive file access events found in the selected period.")
Detectie van beacongedrag
Detecteer potentiële command-and-control door regelmatige uitgaande verbindingen te clusteren op lage bytevolumes gedurende lange duur.
# Setup
from pyspark.sql.functions import col, to_timestamp, window, count, avg, stddev, hour, date_trunc
from sentinel_lake.providers import MicrosoftSentinelProvider
import matplotlib.pyplot as plt
import pandas as pd

data_provider = MicrosoftSentinelProvider(spark)
device_net_events = "DeviceNetworkEvents"
workspace_id = "<your-workspace-id>"

network_df = data_provider.read_table(device_net_events, workspace_id)

# Add hour bucket to group by frequency
network_df = network_df.withColumn("HourBucket", date_trunc("hour", col("Timestamp")))

# Group by device and IP to count hourly traffic
hourly_traffic = network_df.groupBy("DeviceName", "RemoteIP", "HourBucket") \
    .agg(count("*").alias("ConnectionCount"))

# Count number of hours this IP talks to device
stats_df = hourly_traffic.groupBy("DeviceName", "RemoteIP") \
    .agg(
        count("*").alias("HoursSeen"),
        avg("ConnectionCount").alias("AvgConnPerHour"),
        stddev("ConnectionCount").alias("StdDevConnPerHour")
    )

# Filter beacon-like traffic: low stddev, repeated presence
beacon_candidates = stats_df.filter(
    (col("HoursSeen") > 10) &
    (col("AvgConnPerHour") < 5) &
    (col("StdDevConnPerHour") < 1.0)
)

beacon_candidates.show(truncate=False)

# Choose one Device + IP pair to plot
example = beacon_candidates.limit(1).collect()[0]
example_device = example["DeviceName"]
example_ip = example["RemoteIP"]

# Filter hourly traffic for that pair
example_df = hourly_traffic.filter(
    (col("DeviceName") == example_device) &
    (col("RemoteIP") == example_ip)
).orderBy("HourBucket")

# Convert to Pandas and plot
example_pd = example_df.toPandas()
example_pd["HourBucket"] = pd.to_datetime(example_pd["HourBucket"])

plt.figure(figsize=(12, 5))
plt.plot(example_pd["HourBucket"], example_pd["ConnectionCount"], marker="o", linestyle="-")
plt.title(f"Outbound Connections – {example_device} to {example_ip}")
plt.xlabel("Time (Hourly)")
plt.ylabel("Connection Count")
plt.grid(True)
plt.tight_layout()
plt.show()