Groups in a Report Builder paginated report
Applies to: ![]() Microsoft Report Builder (SSRS)
Microsoft Report Builder (SSRS) ![]() Power BI Report Builder
Power BI Report Builder ![]() Report Designer in SQL Server Data Tools
Report Designer in SQL Server Data Tools
In a paginated report, a group is a named set of data from the report dataset bound to a data region. Basically, a group organizes a view of a report dataset. All groups in a data region specify different views of the same report dataset.
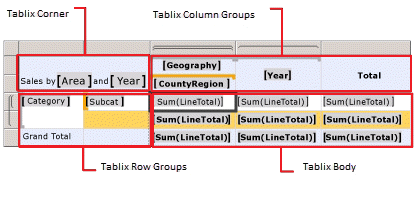
To help visualize what a group is, refer to the following figure that shows the tablix data region in Preview. In this figure, the row groups categorize the dataset by product type, and the column groups categorize the dataset by geographic region and year.
The following sections help describe the various aspects of groups.
Note
You can create and modify paginated report definition (.rdl) files in Microsoft Report Builder, Power BI Report Builder, and in Report Designer in SQL Server Data Tools.
Parts of a group
A group has a name and a set of group expressions that you specify. The set of group expressions can be a single dataset field reference or a combination of multiple expressions. At runtime, group expressions are combined if the group has multiple expressions, and then they get applied to data in a group. For example, you have a group that uses a date field to organize the data in the data region. At run time, Report Builder organizes the data by date, and then it displays those dataset values for each date.
Use groups
In most cases, Report Builder and Report Designer automatically create a group for you when you design a data region. For a table, matrix, or list, groups are created when you drop fields on the Grouping pane. For a chart, groups are created when you drop fields on the chart drop-zones. For a gauge, you must use the Gauge Properties dialog box. For a table, matrix, or list, you can also create a group manually. For more information, see Add or delete a group in a data region in a paginated report (Report Builder). For an example of how to add groups when you create a report, see Tutorial: Create a basic table report (Report Builder) or Create a basic table report (SSRS tutorial).
Modify a group
After you create a group, you can set data region-specific properties, such as filter and sort expressions, page breaks, and group variables to hold scope-specific data. For more information, see Filter, group, and sort data in paginated reports (Report Builder).
To modify an existing group, open the appropriate Group Properties dialog box. You can change the name of the group. You can specify group expressions based on a single field or multiple fields, or on a report parameter that specifies a value at run time. You can also base a group on a set of expressions, such as the set of expressions that specify age ranges for demographic data. For more information, see Group expression examples in paginated reports (Report Builder).
Note
If you change the name of a group, you must manually update any group expressions that refer to the previous name of the group.
Organize groups
Groups are internally organized as members of one or more hierarchies for each data region. A group hierarchy has parent/child groups that are nested and can have adjacent groups. You can better design data regions that display different views of the same data by specifying identical group expressions.
If you think of the parent/child groups as a tree structure, each group hierarchy is a forest of tree structures. A tablix data region includes a row group hierarchy and a column group hierarchy. Data associated with row group members expands horizontally across the page, and data associated with column group members expands vertically down the page. The Grouping pane displays row group and column group members for the currently selected tablix data region on the design surface. For more information, see Grouping pane in a paginated report (Report Builder).
A chart data region includes a category group hierarchy and a series group hierarchy. Category Group members are displayed on the category axis and Series Group members are displayed on the series axis.
Although typically not needed for gauge data regions, groups let you specify how to group data to aggregate on the gauge.
Types of groups available in data region
Data regions that expand as a grid support different groups compared to data regions that display summary data visually. Thus, a tablix data region, and the tables, lists, and matrices that are based on the tablix data region, support different groups than a chart or gauge. The following sections discuss grouping in each type of data region.
Note
Although groups have different names in different data regions, the principles behind how you create and use groups are the same. When you create a group for a data region, you specify a way to organize the detail data from the dataset that's linked to the data region. Each data region supports a group structure on which to display grouped data.
Groups in a tablix data region: details, rows, and column groups
A tablix data region enables you to organize data into groups by rows or columns. However, row and column groups aren't the only groups available in a tablix data region. This data region can have the following types of groups:
The Details group consists of all data from a report dataset after Report Builder or Report Designer apply dataset and data region filters. Thus, the Details group is the only group that has no group expression.
The Details group specifies the data you see when you run a dataset query in a query designer. For example, you have a query that retrieves all columns from a sales order table. The data in this detail group includes all the values for every row for all the columns in the table. The data in this detail group also includes values for any calculated dataset fields that you create.
Note
Data in the Details group can also include server aggregates, which are aggregates that are calculated on the data source and retrieved in your query. By default, Report Builder and Report Designer treat server aggregates as detail data unless your report includes an expression that uses the Aggregate function. For more information, see Report Builder functions - Aggregate function in a paginated report (Report Builder).
By default, when you add a table or list to your report, Report Builder and Report Designer automatically create the Details group for you. It then adds a row to display the detail data. By default, when you add dataset fields to cells in this row, you see simple expressions for the fields, for example,
Sales. When you view the data region, the Details row repeats once for every value in the result set.Row groups and column groups let you organize data into groups by rows or columns. Row groups expand vertically on a page. Column groups expand horizontally on a page. Groups can be nested, for example, group first by
Year, then byQuarter, then byMonth. Groups can also be adjacent, for example, group onTerritoryand independently onProductCategory.When you create a group for a data region, Report Builder and Report Designer automatically add rows or columns to the data region and use these rows or columns to display group data.
Recursive hierarchy groups organize data from a single report dataset that includes multiple levels. For example, a recursive hierarchy group could display an organization hierarchy. For example, you might have an
Employeethat reports to anEmployee. Reporting Services provides group properties and built-in functions to enable you to create groups for this kind of report data. For more information, see Create recursive hierarchy groups in a paginated report (Report Builder).
The following list summarizes the way you work with groups for each data region:
Table defines nested row groups, adjacent row groups, and recursive hierarchy row groups, such as for an organizational chart. By default, a table includes a details group. Add groups by dragging dataset fields to the Grouping pane for a selected table.
Matrix defines nested row and column groups, and adjacent row and column groups. Add groups by dragging dataset fields to the Grouping pane for a selected matrix.
List by default supports the details group. Typical use for a List is to support one level of grouping. Add groups by dragging dataset fields to the Grouping pane for a selected list.
After you add a group, the row and column handles of the data region change to reflect group membership. When you delete a group, you have the choice between only deleting the group definition or deleting the group and all its associated rows and columns. For more information, see Cells, rows, & columns in a tablix in a paginated report (Report Builder).
To limit the data to display or use in calculations for detail or group data, set filters on the group. For more information, see Add dataset filters, data region filters, and group filters to a paginated report (Report Builder).
By default, when you create a group, the sort expression for the group is the same as the group expression. To change the sort order, change the sort expression. For more information, see Filter, group, and sort data in paginated reports (Report Builder).
Understand group membership for tablix cells
Cells in a row or column of a tablix data region can belong to multiple row and column groups. When you define an expression in the text box of a cell that uses an aggregate function (for example, =Sum(Fields!FieldName.Value), the default group scope for a cell is the inner most child group to which it belongs. When a cell belongs to both row and column groups, the scope is both innermost groups. You can also write expressions that calculate aggregate subtotals scoped to a group relative to another set of data. For example, you can calculate the percent of a group relative to the column group or to all data for the data region (such as =Sum(Fields!FieldName.Value)/Sum(Fields!FieldName.Value,"ColumnGroup")). For more information, see Tablix data region in a paginated report (Report Builder) and Expression scope for totals, aggregates, and built-in collections in a paginated report (Report Builder).
Related content
Feedback
Binnenkort beschikbaar: In de loop van 2024 zullen we GitHub-problemen geleidelijk uitfaseren als het feedbackmechanisme voor inhoud en deze vervangen door een nieuw feedbacksysteem. Zie voor meer informatie: https://aka.ms/ContentUserFeedback.
Feedback verzenden en weergeven voor