Notitie
Voor toegang tot deze pagina is autorisatie vereist. U kunt proberen u aan te melden of de directory te wijzigen.
Voor toegang tot deze pagina is autorisatie vereist. U kunt proberen de mappen te wijzigen.
In dit artikel wordt beschreven hoe u kunt werken met de functie voor gegevenstips in Visual Studio. Gegevenstips bieden een handige manier om informatie over variabelen in uw programma weer te geven tijdens het opsporen van fouten in uw code. Wanneer u onderbrekingspunten in uw code instelt en begint met debuggen, zijn gegevenstips zichtbaar voor variabelen wanneer ze de huidige scope van uitvoering bereiken. U kunt de gegevenstip gebruiken om de waarde voor een variabele in het bereik te wijzigen en de code opnieuw uit te voeren over het onderbrekingspunt om het effect van de wijziging te bekijken.

Fooi
Als u nieuw bent met foutopsporing, zou u misschien Foutopsporing voor absolute beginners en Technieken en hulpmiddelen voor foutopsporing willen lezen voordat u dit artikel doorneemt.
Voorwaarden
Visual Studio. Als u Visual Studio niet hebt, gaat u naar de Visual Studio-downloadpagina pagina om deze gratis te installeren.
Sommige programmacode die moet worden uitgevoerd in het Visual Studio-foutopsporingsprogramma.
Werken met gegevenstips
Gegevenstips zijn zichtbaar tijdens een foutopsporingssessie wanneer u onderbrekingspunten hebt ingesteld in uw code. Wanneer de debugger de uitvoering van het programma onderbreekt op een breekpunt, zijn gegevensinfo beschikbaar voor alle variabelen binnen het huidige bereik.
Vanaf Visual Studio 2022 versie 17.14 kunt u ook tips voor gegevens weergeven voor LINQ-expressies.
Dit is het proces:
Stel een onderbrekingspunt in uw code in en start de foutopsporing door Foutopsporing>Foutopsporing starten te selecteren of de sneltoets F5 te gebruiken.
Wanneer de debugger de uitvoering onderbreekt op het onderbrekingspunt, plaatst u de muisaanwijzer op een variabele in het huidige bereik om de data tip te openen.
Gebruik de gegevenstip om de naam van de variabele te bekijken en met de waarde te werken.
Wijzig indien nodig de waarde voor een variabele of voeg opmerkingen toe.
Notitie
Visual Studio evalueert en geeft de waarde voor de variabele weer in een gegevenstip op basis van de context waarin het foutopsporingsprogramma is onderbroken bij de uitvoering. Evaluatie is niet gebaseerd op de huidige locatie van de cursor of gegevenstip. Als u de muisaanwijzer boven een variabele in een andere functie plaatst die dezelfde naam heeft als een variabele in de huidige context, geeft Visual Studio de waarde van de variabele weer in de gegevenstip voor de huidige context.
Visual Studio ondersteunt veel acties voor gegevenstips en het werken met de variabelen en waarden, waaronder:
- Een gegevenstip vastpinnen of laten zweven om deze zichtbaar te houden terwijl de code wordt uitgevoerd
- Gegevenstips transparant maken
- Schakel vastgezette datatips in die uitgevouwen blijven totdat u elders iets selecteert.
- Vouw de gegevenstip voor een matrix, structuur of object uit om de leden ervan weer te geven in een structuurindeling
- De waarde voor een variabele in een gegevenstip wijzigen
- Opmerkingen met meerdere regels toevoegen aan een vastgemaakte gegevenstip voor het maken van notities tijdens foutopsporing
- Tips voor het importeren en exporteren van gegevens
Gegevenstips transparant maken
Wanneer u de muisaanwijzer boven een variabele beweegt om de gegevenstip weer te geven, kunt u de gegevenstip transparant maken om de code eronder weer te geven. Met deze actie wordt ook transparantie ingeschakeld voor andere tipacties in de code-editor, zoals methodedefinities en expressiesyntaxis.
Voer de volgende stappen uit om transparantie in te schakelen:
Selecteer in de Visual Studio Code-editor een datatip en houd Ctrl ingedrukt.
Als u de transparantie wilt behouden, houdt u Ctrl ingedrukt.
Als u de transparantie wilt beëindigen, kiest u Ctrl of maakt u een andere selectie.
Transparantie is niet beschikbaar voor een gepinde of zwevende datatip.
Datatips uitgevouwen houden
Wanneer u in Visual Studio 2022 Update 1 en hoger een gegevenstip uitvouwt, kunt u deze uitgevouwen houden totdat u ergens anders selecteert. Deze actie produceert een plakkerige datatip.
Om een gegevenshint vast te zetten, voert u de volgende stappen uit:
Selecteer in Visual Studio Foutopsporing>Opties om het dialoogvenster Opties te openen.
In het tabblad Algemeen, scrol naar de optie Uitgebreide gegevenstips openhouden tot deze worden weg geklikt.
Vink het selectievakje aan om de vastzetoptie in te schakelen en selecteer OK.
Wanneer de plakoptie is ingeschakeld en u een gegevenstip in de code-editor uitvouwt, blijft deze uitgevouwen.
Tips voor gegevens vastzetten
U kunt een data-tip vastmaken om deze open te houden op het oppervlak van de code-editor. U kunt ook de locatie van de vastgemaakte gegevenstip wijzigen.
Om een datatip vast te zetten, volg deze stappen:
Plaats de muisaanwijzer in de Visual Studio Code-editor op een variabele om de gegevenstip weer te geven.
Gebruik in de gegevenstip de punaise om Vastmaken aan bron te selecteren:
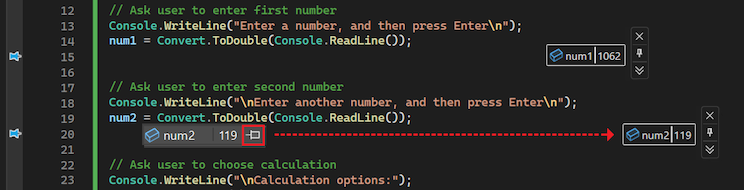
Visual Studio maakt de gegevenstip vast aan een locatie in de buurt van de variabele op het codeoppervlak. Er verschijnt een punaise in de rugmarge van de code-editor naast de regel waar u de gegevenstip vastpint.
Selecteer en sleep de gepinde gegevenstip naar een locatie op het oppervlak van de code-editor.
Tips voor zwevende gegevens (losmaken)
Nadat u een gegevenstip hebt vastgemaakt, kunt u de gegevenstip losmaken en deze laten zweven. Een zwevende gegevenstip kan overal in de Visual Studio IDE worden geplaatst.
Als u een gegevenstip wilt laten zweven, voert u de volgende stappen uit:
Gebruik in een gepinde gegevenstip de punaise om Losmaken van bronte selecteren.
Visual Studio maakt de datatip los en geeft de datatip een effen kleurenachtergrond. De punaise voor de gegevenstip verandert in de losgemaakte positie en de punaise in de rugmarge van de code-editor wordt verwijderd.
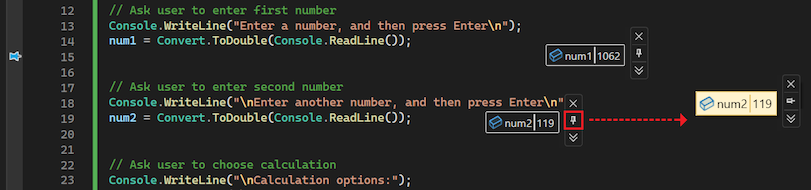
Selecteer en sleep de zwevende gegevenstip naar een willekeurige locatie in de Visual Studio IDE.
Als u de zwevende gegevenstip buiten het oppervlak van de code-editor plaatst, wordt de punaise verwijderd uit het menu aan de zijkant van de gegevenstip. De optie Aan bron vastmaken is alleen beschikbaar wanneer de zwevende gegevenstip op het oppervlak van de code-editor staat.
Tips voor het opnieuw maken van gegevens
Nadat u een datatip hebt weergegeven, kunt u deze opnieuw vastpinnen op een specifieke bronlocatie in de code-editor.
Voer de volgende stappen uit om een zwevende gegevenstip opnieuw te maken:
Selecteer en verplaats de zwevende gegevenstip en plaats deze op het code-editoroppervlak.
Gebruik in de zwevende gegevenstip de punaise om Vastmaken aan bronte selecteren.
De punaise verandert naar de vastgezette positie. De gegevenstip wordt opnieuw vastgemaakt aan een specifieke locatie in de code-editor en er wordt een punaise voor de bron weergegeven in de rugmarge van de code-editor.
Tips voor het sluiten van gegevens
Er zijn verschillende manieren waarop u datatips kunt sluiten in Visual Studio.
Wanneer u de foutopsporingssessie beëindigt, sluit Visual Studio eventuele open gegevenstips voor u. Als u een andere foutopsporingssessie start, probeert Visual Studio alle gegevenstips die u eerder hebt geopend, opnieuw te herstellen.
De volgende tabel bevat een overzicht van hoe u gegevenstips handmatig kunt sluiten:
| Sluit doelwit | Actie |
|---|---|
| Specifieke gegevenstip | Selecteer de X- in de gegevenstip. |
| Alle tips voor gegevens voor een specifiek bestand | Selecteer Debuggen>Alle DataTips wissen die zijn vastgezet aan <bestandsnaam> op de werkbalk van Visual Studio. |
| Alle tips voor geopende gegevens | Selecteer Debuggen>Wis alle DataTips op de werkbalk van Visual Studio. |
Werken met variabelen en waarden in gegevenstips
Wanneer u met gegevenstips in Visual Studio werkt, krijgt u de mogelijkheid om details over variabelen en objecten te bekijken en waarden te bewerken tijdens foutopsporing. Deze mogelijkheden zijn handig voor snelle probleemoplossing en het testen van wijzigingen in uw code.
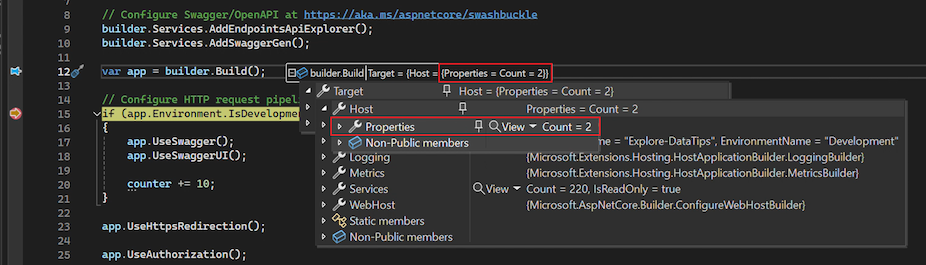
Objecten uitvouwen in gegevenstips om leden te bekijken
Wanneer een gegevenstip een matrix, structuur of object vertegenwoordigt, kunt u de weergave gegevenstip uitvouwen om de leden te zien. In de uitgebreide weergave ziet u de extra informatie in een hiërarchische boomstructuur.
Voer de volgende stappen uit om de weergave voor een object in een gegevenstip uit te vouwen:
Selecteer in een gegevenspunt voor een matrix, structuur of object de uitvouwpijl voor de naam van het item om de leden weer te geven. De weergave wordt gepresenteerd in een boomstructuur.
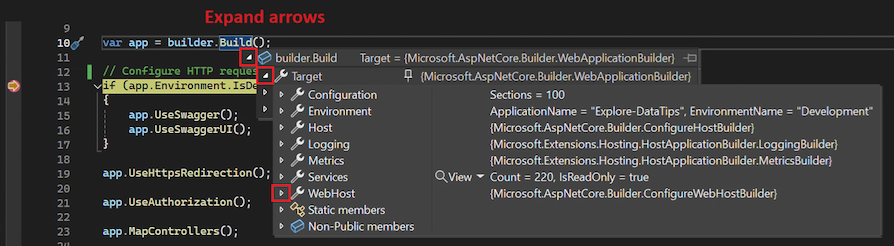
Voor een vastgemaakte gegevenstip selecteert u het plusteken (+) vóór de naam van de variabele om de definitie uit te vouwen.
Blijf de uitklappijlen selecteren om meer van de ledenhiërarchie weer te geven.
Als u omhoog en omlaag wilt gaan in de uitgevouwen weergave, gebruikt u de pijl-omhoog of pijl-omlaag met de muis of het toetsenbord.
Als u een uitgevouwen element wilt vastmaken met de oorspronkelijk vastgezette datatip, gebruik dan de punaise voor het element om Vastmaken aan bron te selecteren. Nadat u de structuurweergave hebt samengevouwen, blijven alle vastgemaakte lidelementen zichtbaar met de vastgemaakte gegevenstip.

Variabelewaarden bewerken
Een ander voordeel van het werken met gegevenstips is de mogelijkheid om de waarde van een variabele of element in een gegevenstip te bewerken tijdens foutopsporing. Deze functionaliteit is handig voor het snel testen van kleine wijzigingen in uw code.
Voer de volgende stappen uit om de waarde van een variabele of element in een gegevenstip te bewerken:
Selecteer de waarde in de gegevenstip. Visual Studio markeert de waarde en maakt deze beschikbaar voor bewerking.
Voer een nieuwe waarde in de gegevenstip in en selecteer Voerin.
Houd er rekening mee dat sommige variabele waarden alleen-leesbaar zijn. Visual Studio maakt geen alleen-lezenwaarden beschikbaar voor bewerking.
Opmerkingen gebruiken in gegevenstips
De Opmerkingen regio van een gegevenstip is handig voor het bijhouden van notities over variabelen tijdens het opsporen van fouten in uw code. Dit gebied is een handige plek om verschillende waarden bij te houden als ze veranderen tijdens het opsporen van fouten. U kunt opmerkingen toevoegen aan een vastgemaakte of zwevende gegevenstip.
Als u Opmerkingen in een gegevenstip wilt gebruiken, voert u de volgende stappen uit:
Gebruik in de datatip de dubbele pijl-omlaag toets om Uitvouwen te selecteren om opmerkingen te bekijken. Met de dubbele pijl naar beneden opent u het opmerkingengebied van de gegevenshint waar u notities kunt toevoegen.
Als u een opmerking wilt toevoegen, voegt u de cursor in de opmerkingen regio in en voert u tekst in. De regio accepteert meerdere lijnen.
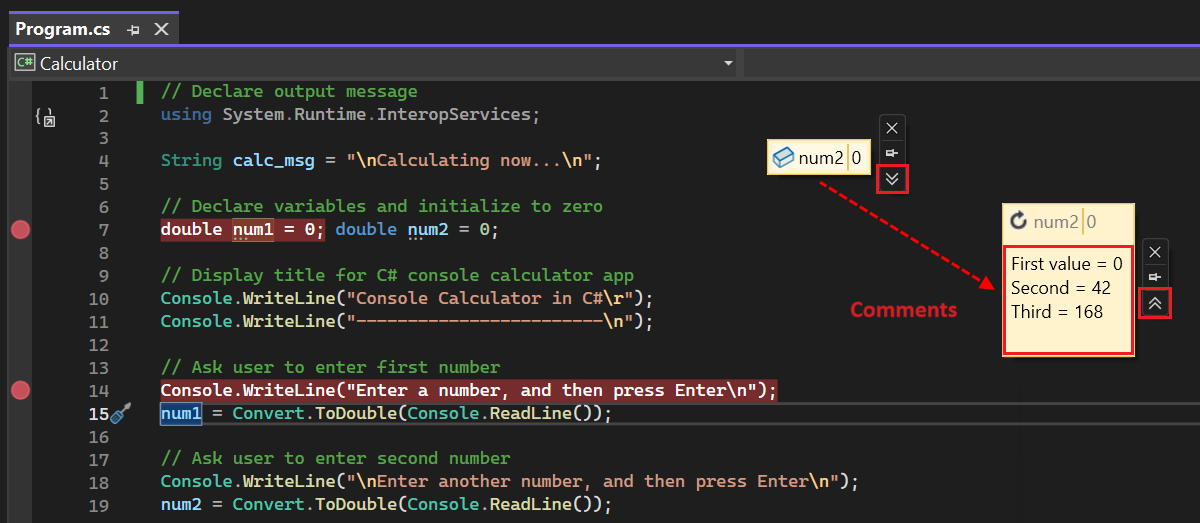
Als u de regio Opmerkingen wilt sluiten, gebruikt u de dubbele pijl-omhoog om opmerkingen te Samenvouwen. Opmerkingen die u invoert, blijven gekoppeld aan het gegevensvenster, maar zijn momenteel niet zichtbaar.

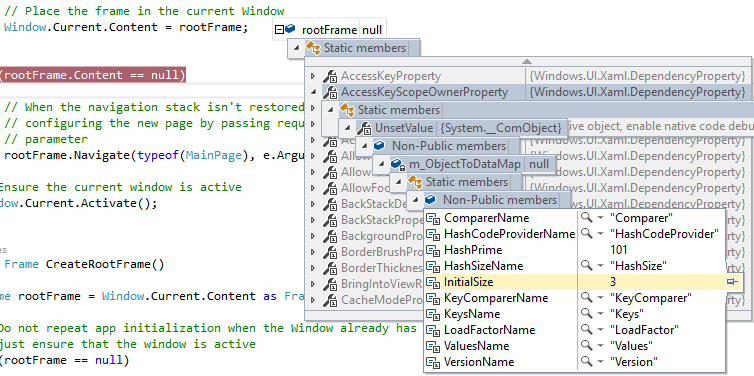
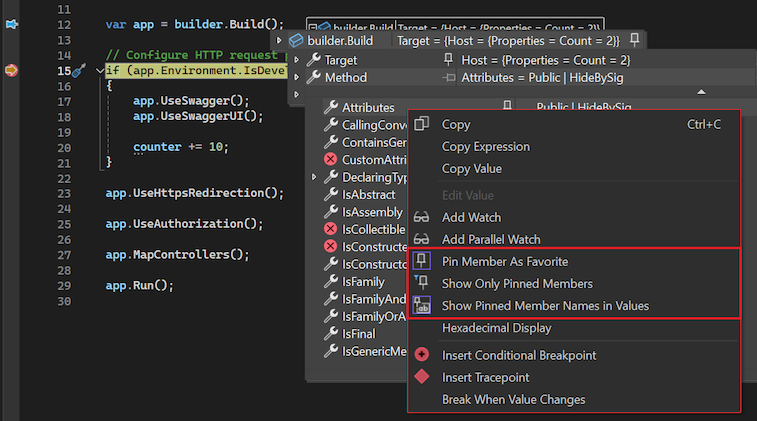
Eigenschappen vastmaken in gegevenstips
Visual Studio ondersteunt het vastzetten van eigenschappen in vastgezette gegevenstips in .NET Core 3.0 en hoger. Met deze functie kunt u objecten snel inspecteren op basis van hun eigenschappen in gegevenstips.
Volg deze stappen om eigenschappen vast te zetten in gegevenstips:
Vouw in een vastgezette gegevenstip de hiërarchie van leden uit totdat u een eigenschap ziet die u met de gegevenstip zichtbaar wilt houden.
Gebruik de punaise voor de eigenschap en zet het vast met de informatietip. U kunt ook met de rechtermuisknop op de eigenschap klikken en Lid vastpinnen als favorietselecteren.
Visual Studio verplaatst de geselecteerde eigenschap naar het begin van de eigenschappenlijst van het object. De naam en waarde van de eigenschap worden weergegeven in de rechterkolom van de vastgemaakte gegevenstip:
Als u een eigenschap in een gegevenstip wilt losmaken, selecteert u de punaise voor de eigenschap opnieuw of klikt u met de rechtermuisknop op de eigenschap en selecteert u Lid losmaken als favoriet.
U kunt ook in een datatip de zichtbaarheid van eigenschapsnamen in- of uitschakelen en niet-verankerde eigenschappen uitfilteren in de eigenschappenlijst van het object.
Als u niet-vastgezette eigenschappen wilt filteren, klikt u met de rechtermuisknop op de eigenschapsrij in de tooltip en selecteert u Alleen vastgezette leden weergeven.
Als u de zichtbaarheid van eigenschapsnamen wilt in- of uitschakelen, klikt u met de rechtermuisknop op de eigenschapsrij in de gegevenstip en selecteert u Vastgemaakte lidnamen verbergen in waarden.
Op de volgende afbeelding ziet u de verschillende opties in het snelmenu voor de ledenhiërarchie in een gegevenshint.
Hulp bij AI krijgen
Als u Copilot-hebt, kunt u AI-hulp krijgen terwijl u variabelen in gegevenstips bekijkt. Klik met de rechtermuisknop op een variabele en gebruik de Ask Copilot knop. In dit scenario kent Copilot al de context voor uw vraag, dus u hoeft zelf geen context te bieden in de chat. Zie Fouten opsporen met Copilotvoor meer informatie.
Vanaf Visual Studio 2022 versie 17.14 kunt u ook Copilot-hulp krijgen via gegevenstips voor LINQ-expressies.
Complexe gegevenstypen visualiseren
Visuals geven informatie op een zinvollere en soms grafische manier weer. Voorbeelden van visualisaties zijn XML, HTML, JSON, Text Visualizeren de visualisaties in tabelvorm. U kunt visualisaties gebruiken om complexe gegevenstypen in uw code te onderzoeken tijdens foutopsporing.
Als visualisaties beschikbaar zijn voor een element, geeft Visual Studio het Weergave vergrootglas weer naast de elementnaam in het gegevenskader. Wanneer u een visualisatie selecteert, opent Visual Studio een afzonderlijk venster om de complexe gegevens in een leesbare indeling weer te geven.
U kunt deze functie gebruiken om een visualisatie voor uw gegevens te selecteren:
Als u het element wilt weergeven met behulp van de standaard visualiseren voor het gegevenstype, selecteert u het vergrootglas.

Als u een specifieke visualisator wilt selecteren, vouwt u de vervolgkeuzelijst Weergave naast het vergrootglas uit en kiest u een optie.
Variabelen toevoegen aan Watch-vensters
U kunt variabelen blijven bekijken door ze toe te voegen aan een Visual Studio Watch-venster vanuit een gegevenstip:
- Klik in de datatip met de rechtermuisknop op de naam van de variabele en selecteer Watch toevoegen.
Visual Studio voegt de variabele toe in het venster Watch. Als uw Visual Studio-editie meerdere Watch-vensters ondersteunt, wordt de variabele weergegeven in het venster met het label Watch 1.
Tips voor het importeren en exporteren van gegevens
U kunt tips voor gegevens exporteren naar een XML-bestand, dat u kunt delen of bewerken met behulp van een teksteditor. U kunt ook een gegevenstips importeren uit een XML-bestand dat u hebt ontvangen of eerder hebt bewerkt.
Voer de volgende stappen uit om gegevenstips te exporteren:
Selecteer in Visual Studio Debuggen>DataTips exporteren. Het dialoogvenster DataTips exporteren wordt geopend.
Blader in het dialoogvenster naar de locatie waar u het XML-bestand wilt opslaan.
Voer een naam in voor het exportbestand en selecteer Opslaan.
Visual Studio exporteert uw gegevenstips naar het opgegeven bestand en de opgegeven locatie.
Voer de volgende stappen uit om gegevenstips uit een bestand te importeren:
Selecteer in Visual Studio Fouten opsporen>Gegevensinfo importeren. Het dialoogvenster Gegevensinfo importeren wordt geopend.
Blader in het dialoogvenster naar de locatie van het XML-bestand met gegevenstips dat u voor het importeren wilt gebruiken.
Selecteer het bestand dat u wilt openen en selecteer openen.
Visual Studio importeert de gegevenstips uit het opgegeven bestand in uw huidige werkruimte. Wanneer u de werkruimtecode opspoort, zijn de tips voor geïmporteerde gegevens beschikbaar.
Verwante inhoud
- Krijg een eerste blik op het foutopsporingsprogramma van Visual Studio
- Verken technieken en hulpprogramma's voor foutopsporing
- Aangepaste weergaven van gegevens maken in het Visual Studio-foutopsporingsprogramma