How to Create a Ping Response Report from the OpsLogix Ping Mgmt. Pack
During a recent customer visit, I was asked how they could create a report that showed their monitored systems ping status. Since the customer already had OpsLogix installed, the easiest solution looked to be creating a report based on data points that were already being gathered.
If you're looking to create your own ping report, or just learn a little more about how reporting in SCOM 2012 R2 works, I hope the information below proves useful.
Requirement: Before beginning, ensure that the OpsLogix Ping Mgmt. Pack is installed and configured for Host(s) and Target(s)
- Download and install the OpsLogix ping Mgmt. Pack: https://www.opslogix.com/download-ping-management-pack/
- Additional information for customizing the OpsLogix Ping Mgmt. Pack: https://www.systemcentercentral.com/customizing-the-opslogix-ping-management-pack-scom-sysctr/
Ready, set, go!
Open the SCOM 2012 R2 - Operations Manager Console
Go to: Reports wunderbar > Microsoft Generic Report Library > Performance 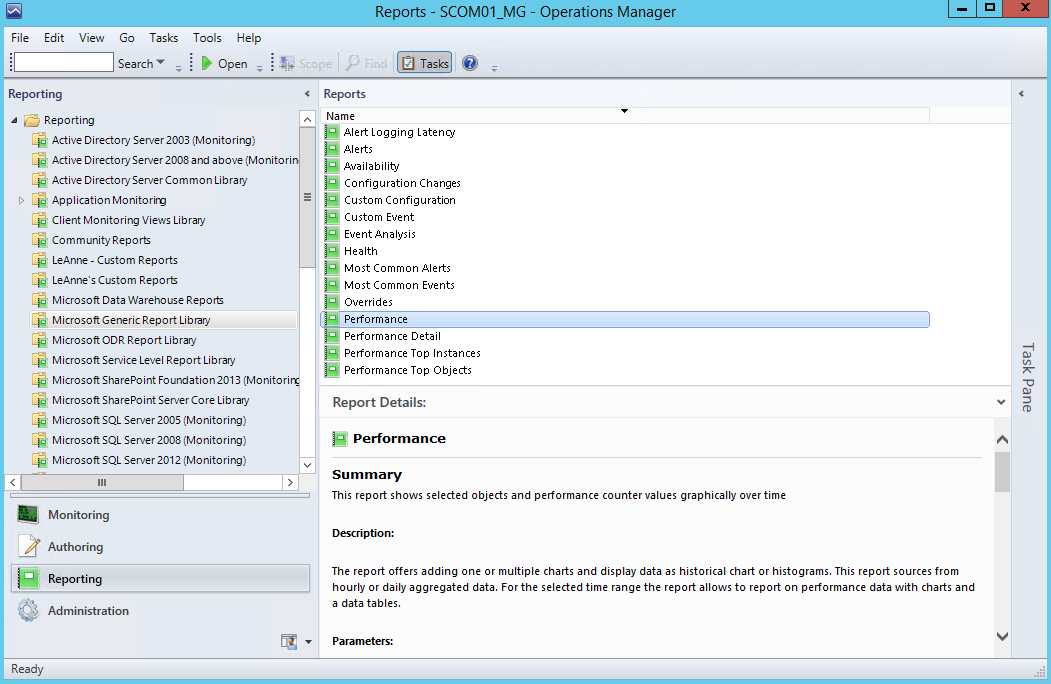
Double-click to open the Performance report template
Select the Change button
Select the New Chart button
Add a Chart Title (for this example "Ping Response Time")
Select the New Series button
Modify the appearance, if desired
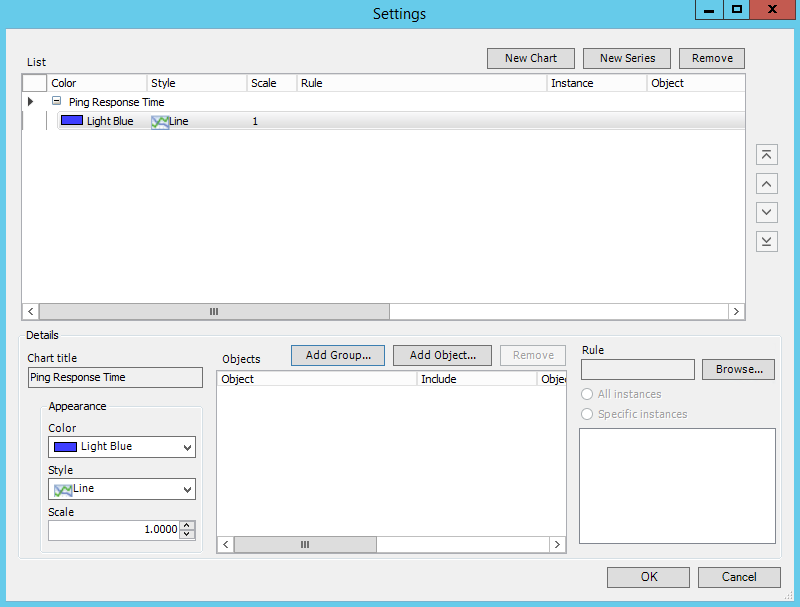
Under the objects section, select the Add Object button
Select the Options button
Select the Add button
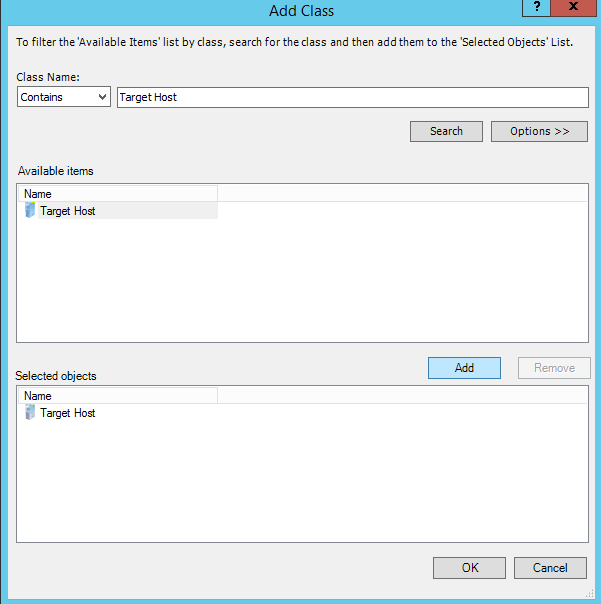
Under Class Name: Contains type (type) Target Host
Select the Search button
Under the Available items cell, select Target Host and Add button
Click OK and OK again to go back to the Add Object dialog box
Note that it now shows "Filter Options have been applied"
Enter an object search work, or simply leave blank and select the Search button
Select one target from the list and add to Selected objects
*If you do not see target hosts available, go back to the Monitoring wunderbar and confirm that they have been added per the OpsLogix documentation
Click OK 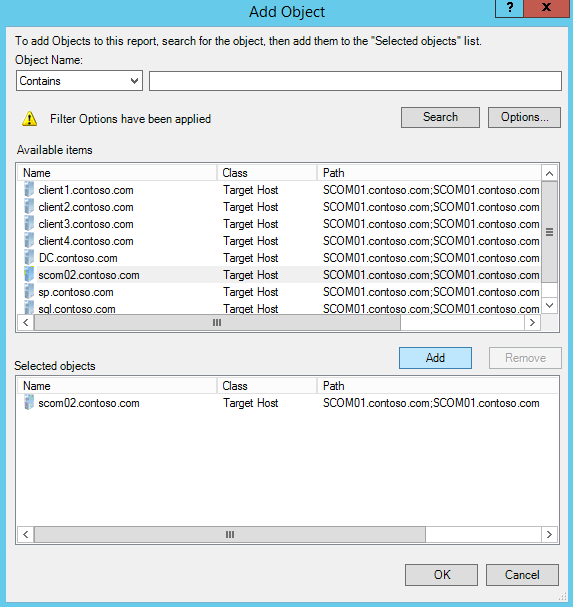
Go to Rule and click Browse
Under Search By Rule Name, type: ping
Select Name=Ping Response Time
Object=Target Host
Click OK
Select Specific instances radio button and chose the associated object check box
Click OK 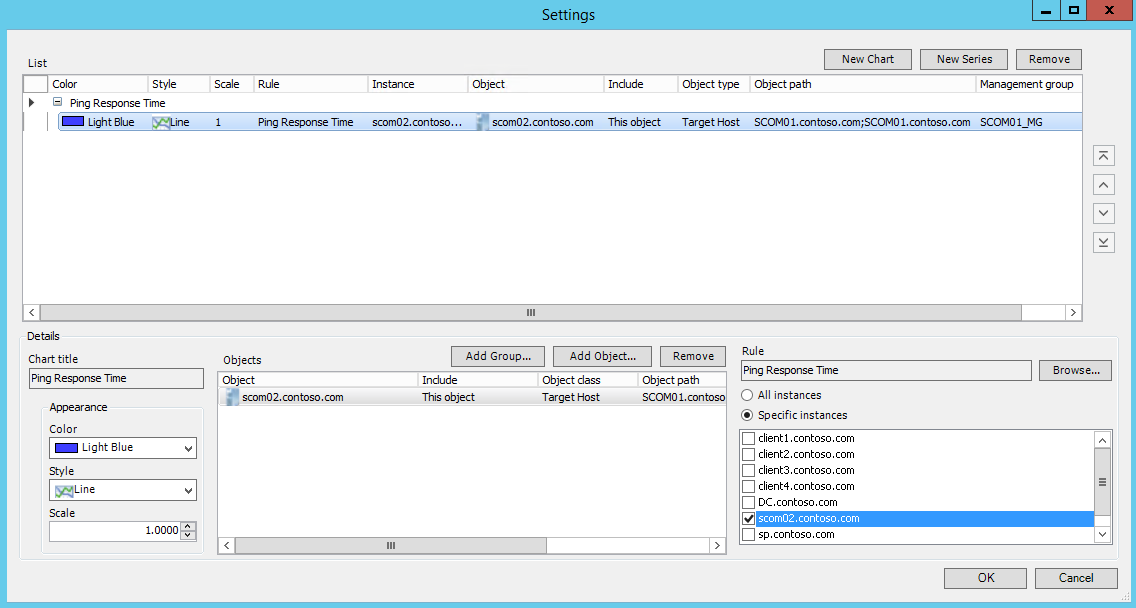
Back on the main Performance - Operations Manager - Report - Mgmt. Group dialog box…
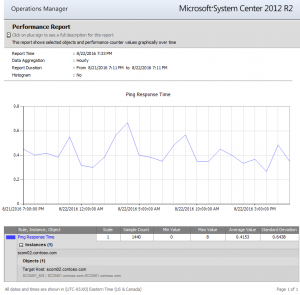
Update the From date to Yesterday and click Run
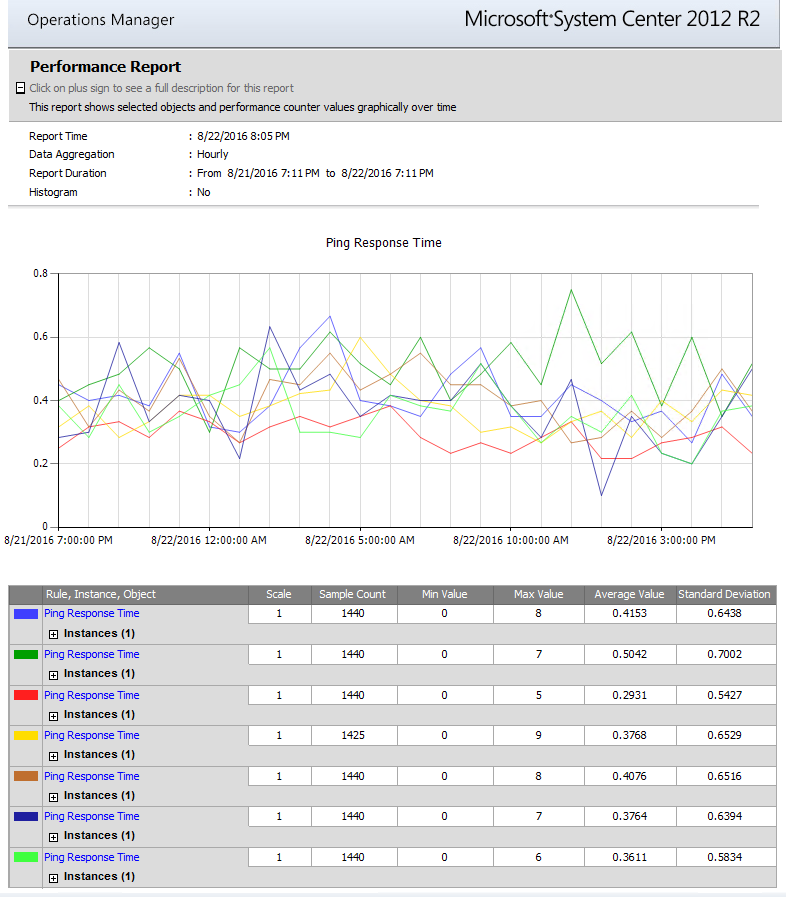
Example Performance and Performance Detail Reports:


If desired, add additional Targets to the report by repeating the above for each target
Show the Parameter Area 
Select Change
Select New Series
Adjust the appearance, if desired
Add the Target Host class filter, per above
Add the Target Object, per above
Add the Rule, per above
Click OK
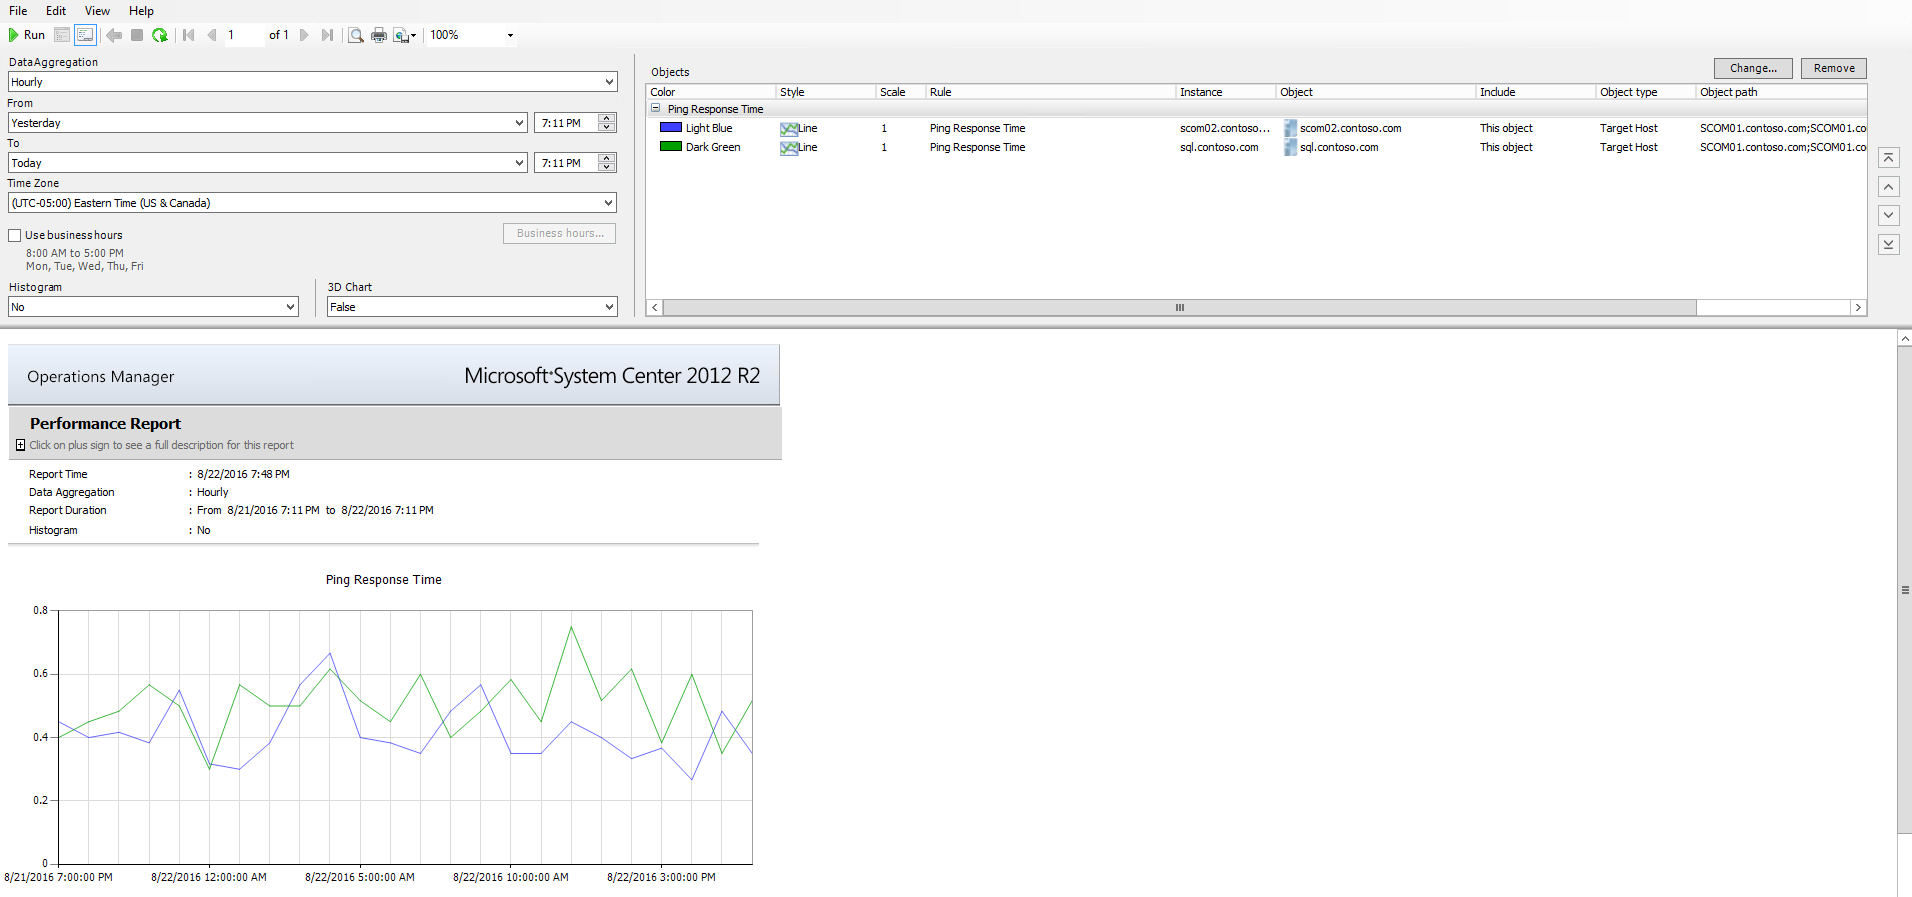
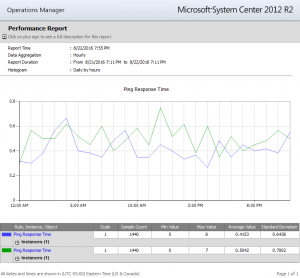
Now there are 2 target systems in the report
If desired, add additional Targets to the report by repeating the above for each
Re-run the Report
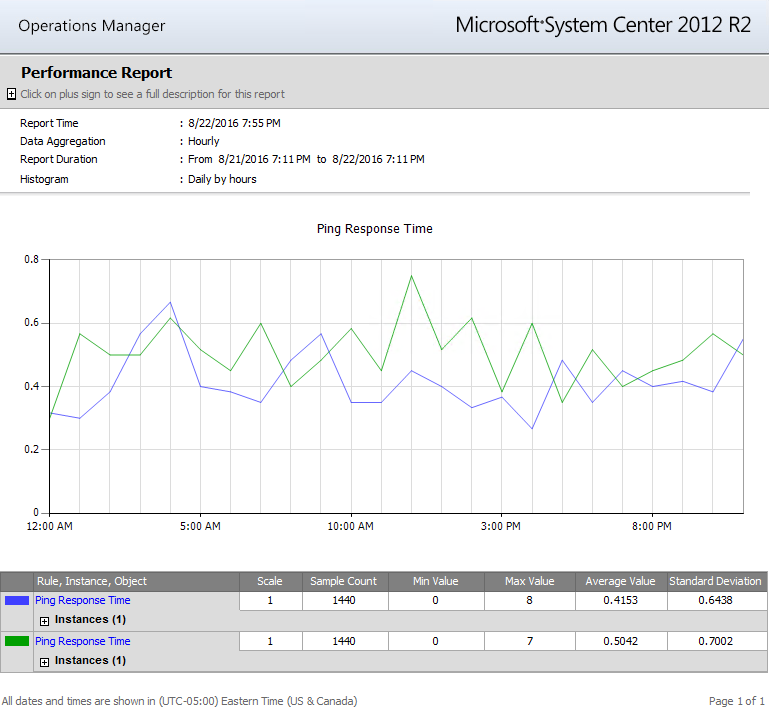
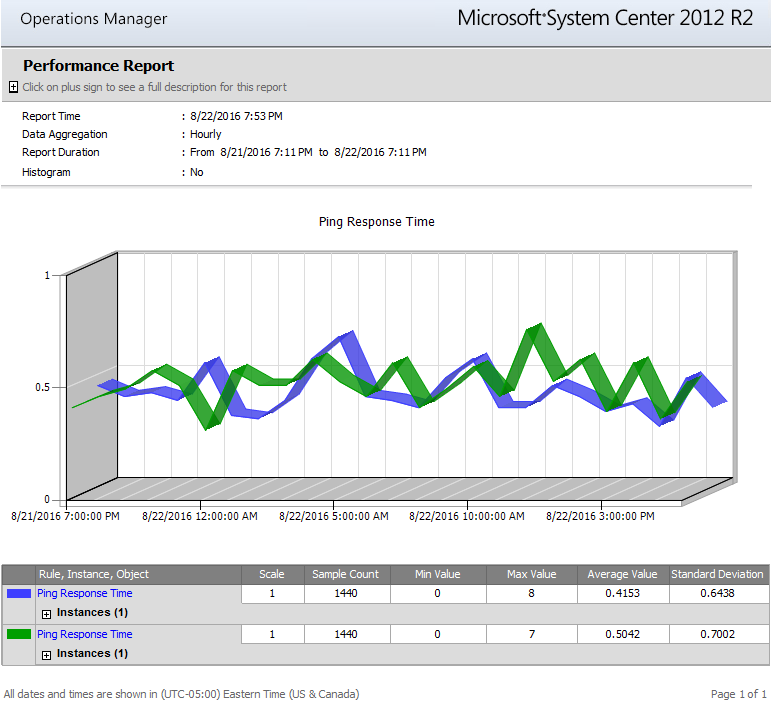
Example modified to show a Histogram and/or 3D Chart
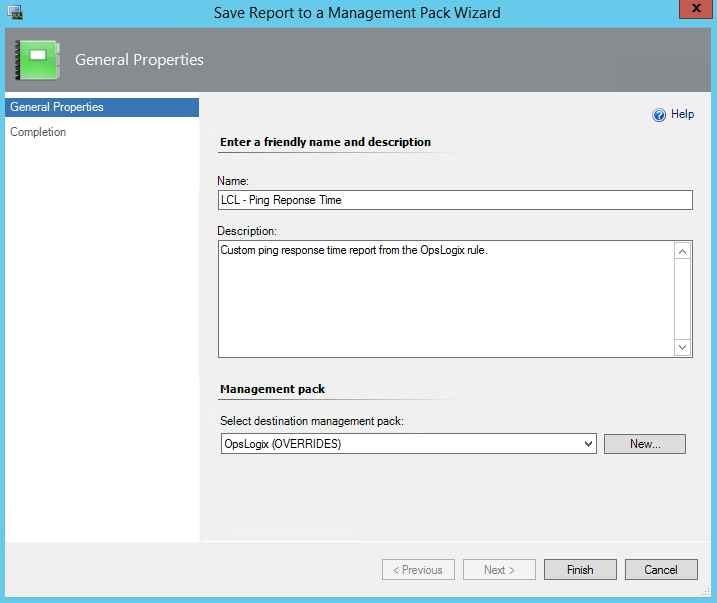
Once completed with building the report save it in a custom Mgmt. Pack 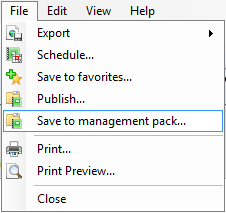
Note: It's recommended to adopt a standard naming convention to any custom reports to allow for quick view into default and custom reporting
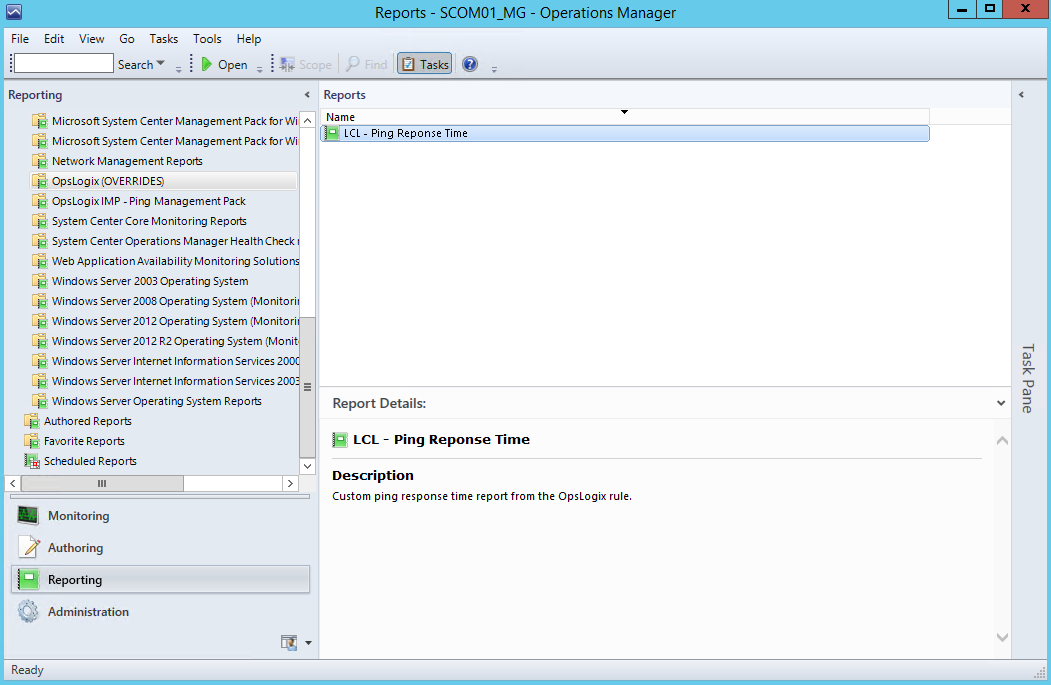
Once saved to a custom Mgmt. Pack, the report can be opened from there.
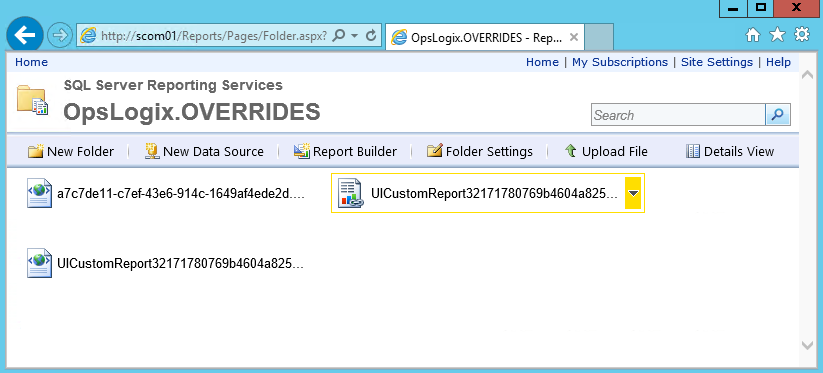
The report can also found on the SQL Server Reporting Services link (SCOM default = htt://%reportservername%/reports)
Happy Ping Reporting!
--End--