Xperf, a new tool in the Windows SDK
The SDK team just shipped the latest version of the Windows SDK which supports Windows Server 2008 and Vista SP1. The SDK now includes an important new tool; the Windows Performance Tool Kit from the Windows performance team (we call them the xperf tools for short...)
This is the first article in the xperf series, the next one is
Xperf Tools Landing Page and Update
The xperf tools have long been an internal tool used by our team, and widely throughout Windows, for system-wide performance analysis. Xperf got its start many years ago as a set of command-line tools that produce reports based off the ETW instrumentation in the kernel[1]. Many other components and applications in Windows are instrumented with ETW and xperf can enable these events, dump them, and analyze them.
Xperf is an important tool for anyone doing system performance work on Windows because it's specifically designed to give you a complete system-wide view of performance over long periods of time (10's of seconds, to minutes)[2]. It's also the only tool that knows how to fully process all the events from the kernel and correlate them into something that makes sense.
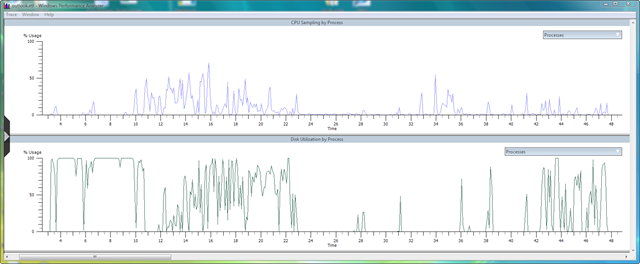
For example, here is a detail graph of all the disk I/O to the system drive on my laptop for opening this post, editing it a bit, and then closing Live Writer.
![screen-capture[5]](https://msdntnarchive.blob.core.windows.net/media/TNBlogsFS/BlogFileStorage/blogs_msdn/pigscanfly/WindowsLiveWriter/NewPerformanceToolintheWindowsSDKXPerf_11405/screen-capture%5B5%5D.png)
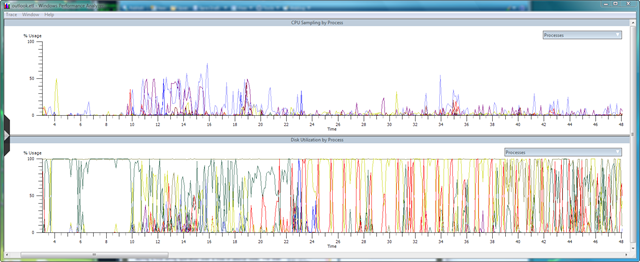
Here is an example of the CPU and disk utilization for Outlook 2007 launch:
Here is the same view, but with the data from all processes visible:
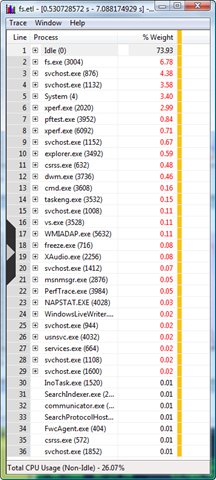 In addition to graphical displays, the tools can also display tabular data (what we call "summary data"). The screen capture to the right is a table of sample profile events during a 6.5 second period during a find string operation over a tree of source code. For that period, 73.93% of the total CPU time was in the idle thread, 6.78% was in the find string utility and the reset of the time was distributed around services, the system, xperf itself (at 3%) and other processes. As you start playing with the summary tables, try shifting around the columns to get different types of views on the data; for example, grouping IOs per process, IO type (read/write/...), IO size, IO service time, and so forth.
These simple examples barely scratch the surface of the data that the tools can gather and the richness of the information they can display. The tools have several other important features including:
- Full support for symbol decoding. This uses the same mechanism as the Debugging Tools for Windows. This includes full support for the public Windows symbols, and for your own symbols.
- The ability to dump all the events from a trace file to a CSV file. If the summary tables don't display what you want, then you can write your own trace processing tools on top of the text dump, or the (generally XML-based) output of the command-line actions.
- Windows Vista supports collecting stack traces on all the kernel events. One of the most useful things to do is collecting stack traces on the sample profile event. This is an extremely powerful tool for understanding where and why a program is spending time.
- The xperf command-line tool can be used to control all the ETW trace providers in a system, including all the kernel events. del.icio.us Tags: tools windows performance
- The xperf distribution also contains a quick start guide and basic reference manual. Just look for the document Performance.Analyzer.QuickStart.docx, its in XPS format as well.
In the coming weeks, I'll blog more about the tools, how to use them, and the kernel ETW events. We'll also soon have a web page up for the tools. This is where you will soon find updates, additional documentation, and a message forum.
Now! Here is how you can get the tools!
- Install the SDK by downloading the ISO image, or using the Web based installer.
- Find the xperf MSI in the SDK's "bin" directory. It will be named xperf_x86.msi, xperf_x64.msi, or xperf_ia64.msi, depending on the architecture for which you install the SDK.
- You can then install the xperf tools from the MSI directly, or copy the xperf MSI file to another location and install it from there. For example, you could keep the MSI files on a USB key.
We'll soon have a web page up for the tools on the MSDN site... stay tuned!
del.icio.us Tags: windows,perfomance,xperf,tools
[1] You can see the events supported by the kernel in the docs for the EnableFlags field of the EVENT_TRACE_PROPERTIES structure. I'm going to blog more about these...
[2] The xperf tools from the Windows Performance Toolkit are very complimentarily to the SysInternals tools.
Comments
Anonymous
February 09, 2008
I’m late in blogging about this but the Windows SDK team has released the newest Windows SDK that correspondsAnonymous
February 11, 2008
The comment has been removedAnonymous
February 11, 2008
What? You can't run this on XP? Is that why XP is so much faster than Vista?Anonymous
February 11, 2008
If a lot of the events are instrumented in the XP kernel why won't the tools run on there as well ? It really would be helpful in a corporate environment, and easier than switching all the desktops to run Solaris 10 (or changing to Mac's) in order to be able to run DTraceAnonymous
February 12, 2008
By now I hope you’ve installed the latest version of the Windows SDK which supports Windows Server 2008,Anonymous
February 13, 2008
Cool.Anonymous
February 13, 2008
The comment has been removedAnonymous
March 12, 2008
If you like delving into the depths of how a Windows system is performing (or not performing) then aAnonymous
March 16, 2008
Here is a chronological list of the my posts about the xperf tools. If you are new to the tools, or simplyAnonymous
June 23, 2008
In my latest article for Windows Vista Magazine I spoke about performance tuning a system and more importantlyAnonymous
June 23, 2008
In my latest article for Windows Vista Magazine I spoke about performance tuning a system and more importantlyAnonymous
October 26, 2008
I have arrived at my first PDC and it’s an awesome experience. The conference is huge and I arrived here for the registration and breakfast and met up with some nice guys. I fetched my bags of good...Anonymous
February 27, 2009
Windows Performance Analyzer XperfAnonymous
February 27, 2009
Windows Performance Analyzer XperfAnonymous
March 24, 2009
Seema Ramchandani works on performance as a Program Manager on the Silverlight team. She gave a fast-paced