Notatka
Dostęp do tej strony wymaga autoryzacji. Może spróbować zalogować się lub zmienić katalogi.
Dostęp do tej strony wymaga autoryzacji. Możesz spróbować zmienić katalogi.
Omówienie i dostęp
Aby móc korzystać z usługi Log Analytics dla dzienników usług Communications Services, należy najpierw wykonać kroki opisane w temacie Włączanie rejestrowania w ustawieniach diagnostycznych. Po włączeniu dzienników i obszaru roboczego usługi Log Analytics będziesz mieć dostęp do wielu przydatnych domyślnych pakietów zapytań, które pomogą Ci szybko zwizualizować i zrozumieć dane dostępne w dziennikach, które opisano poniżej. Dzięki usłudze Log Analytics uzyskasz również dostęp do większej liczby szczegółowych informacji o usługach Communications Services za pośrednictwem skoroszytów usługi Azure Monitor, możliwości tworzenia własnych zapytań i skoroszytów, przeglądu interfejsów API usługi Log Analytics do dowolnego zapytania.
Dostęp
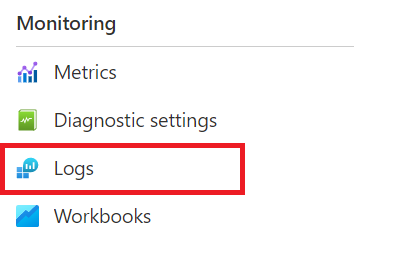
Dostęp do zapytań można uzyskać, uruchamiając stronę zasobów usług Communications Services, a następnie klikając pozycję "Dzienniki" w lewym obszarze nawigacji w sekcji Monitorowanie:
W tym miejscu zostanie wyświetlony ekran modalny zawierający wszystkie domyślne pakiety zapytań dla usług Communications Services, a lista dostępnych pakietów zapytań do nawigacji znajduje się po lewej stronie.

Jeśli zamkniesz ekran modalny, nadal możesz przejść do różnych pakietów zapytań, bezpośrednio uzyskać dostęp do danych w postaci tabel na podstawie schematu dzienników i metryk, które zostały włączone w ustawieniu diagnostycznym. W tym miejscu możesz utworzyć własne zapytania na podstawie danych przy użyciu języka KQL (Kusto). Dowiedz się więcej o używaniu, edytowaniu i tworzeniu zapytań, czytając więcej na temat: Zapytania usługi Log Analytics


Domyślne pakiety zapytań dla podsumowań połączeń i dzienników diagnostycznych połączeń
Poniżej przedstawiono opisy poszczególnych zapytań w domyślnym pakiecie zapytań dla dzienników podsumowania wywołań i diagnostyki wywołań, w tym przykłady kodu i przykładowe dane wyjściowe dla każdego dostępnego zapytania:
Przegląd zapytań dotyczących połączeń
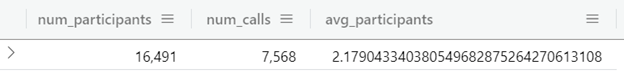
Liczba uczestników w rozmowie
// Count number of calls and participants,
// and print average participants per call
ACSCallSummary
| distinct CorrelationId, ParticipantId, EndpointId
| summarize num_participants=count(), num_calls=dcount(CorrelationId)
| extend avg_participants = todecimal(num_participants) / todecimal(num_calls)
Przykładowe dane wyjściowe:
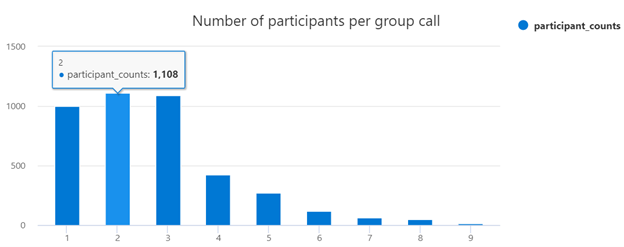
Liczba uczestników na każde połączenie grupowe
// Count number of participants per group call
ACSCallSummary
| where CallType == 'Group'
| distinct CorrelationId, ParticipantId
| summarize num_participants=count() by CorrelationId
| summarize participant_counts=count() by num_participants
| order by num_participants asc
| render columnchart with  (xcolumn = num_participants, title="Number of participants per group call")
Przykładowe dane wyjściowe:
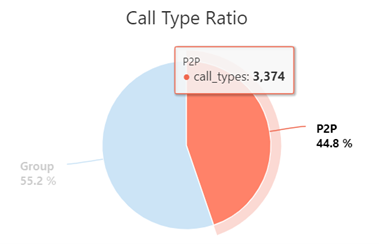
Współczynnik typów wywołań
// Ratio of call types
ACSCallSummary
| summarize call_types=dcount(CorrelationId) by CallType
| render piechart title="Call Type Ratio"
Przykładowe dane wyjściowe:
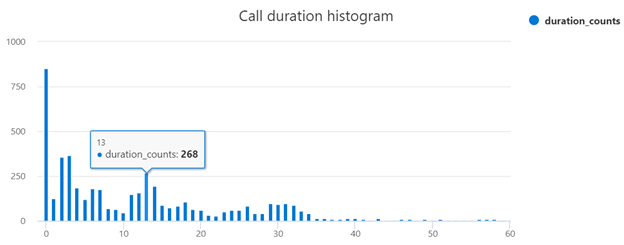
Rozkład czasu trwania wywołań
// Call duration histogram
ACSCallSummary
| distinct CorrelationId, CallDuration
|summarize duration_counts=count() by CallDuration
| order by CallDuration asc
| render columnchart with (xcolumn = CallDuration, title="Call duration histogram")
Przykładowe dane wyjściowe:
Percentyle długości połączeń
// Call duration percentiles
ACSCallSummary
| distinct CorrelationId, CallDuration
| summarize avg(CallDuration), percentiles(CallDuration, 50, 90, 99)
Przykładowe dane wyjściowe:

Zapytania dotyczące informacji o punkcie końcowym
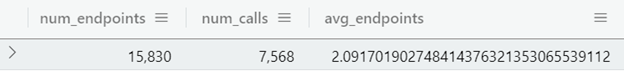
Liczba punktów końcowych na wywołanie
// Count number of calls and endpoints,
// and print average endpoints per call
ACSCallSummary
| distinct CorrelationId, EndpointId
| summarize num_endpoints=count(), num_calls=dcount(CorrelationId)
| extend avg_endpoints = todecimal(num_endpoints) / todecimal(num_calls)
Przykładowe dane wyjściowe:
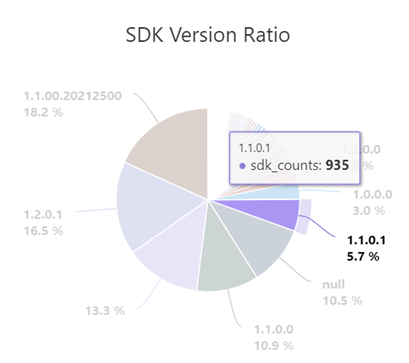
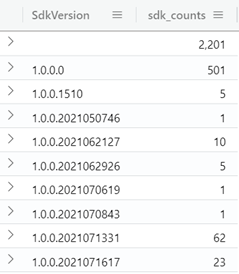
Współczynnik wersji zestawu SDK
// Ratio of SDK Versions
ACSCallSummary
| distinct CorrelationId, ParticipantId, EndpointId, SdkVersion
| summarize sdk_counts=count() by SdkVersion
| order by SdkVersion asc
| render piechart title="SDK Version Ratio"
Przykładowe dane wyjściowe:
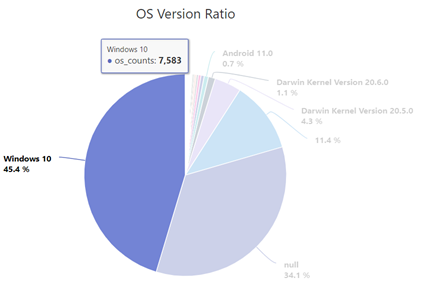
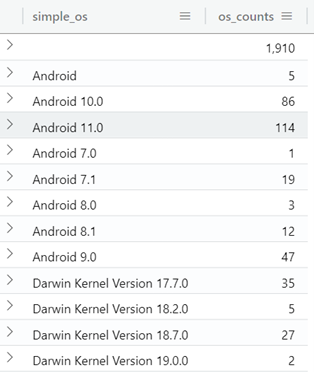
Współczynnik wersji systemu operacyjnego (uproszczona nazwa systemu operacyjnego)
// Ratio of OS Versions (simplified OS name)
ACSCallSummary
| distinct CorrelationId, ParticipantId, EndpointId, OsVersion
| extend simple_os = case(  indexof(OsVersion, "Android") != -1, tostring(split(OsVersion, ";")[0]),
                            indexof(OsVersion, "Darwin") != -1, tostring(split(OsVersion, ":")[0]),
                            indexof(OsVersion, "Windows") != -1, tostring(split(OsVersion, ".")[0]),
                            OsVersion
                        )
| summarize os_counts=count() by simple_os
| order by simple_os asc
| render piechart title="OS Version Ratio"
Przykładowe dane wyjściowe:
Zapytania dotyczące strumienia multimediów
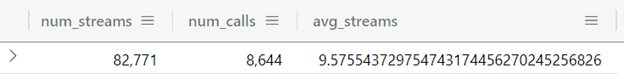
Strumienie na wywołanie
// Count number of calls and streams,
// and print average streams per call
ACSCallDiagnostics
| summarize num_streams=count(), num_calls=dcount(CorrelationId)
| extend avg_streams = todecimal(num_streams) / todecimal(num_calls)
Przykładowe dane wyjściowe:
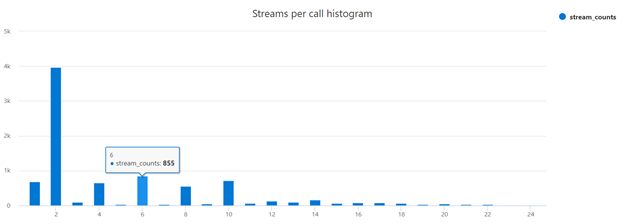
Strumienie na histogram wywołań
// Distribution of streams per call
ACSCallDiagnostics
| summarize streams_per_call=count() by CorrelationId
| summarize stream_counts=count() by streams_per_call
| order by streams_per_call asc
| render columnchart title="Streams per call histogram"
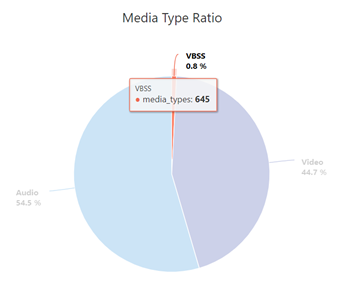
Współczynnik typów multimediów
// Ratio of media types by call
ACSCallDiagnostics
| summarize media_types=count() by MediaType
| render piechart title="Media Type Ratio"
Zapytania metryk jakości
Średnie wartości telemetrii
// Average telemetry values over all streams
ACSCallDiagnostics
| summarize Avg_JitterAvg=avg(JitterAvg),
            Avg_JitterMax=avg(JitterMax),
            Avg_RoundTripTimeAvg=avg(RoundTripTimeAvg),
            Avg_RoundTripTimeMax=avg(RoundTripTimeMax),
            Avg_PacketLossRateAvg=avg(PacketLossRateAvg),
            Avg_PacketLossRateMax=avg(PacketLossRateMax)

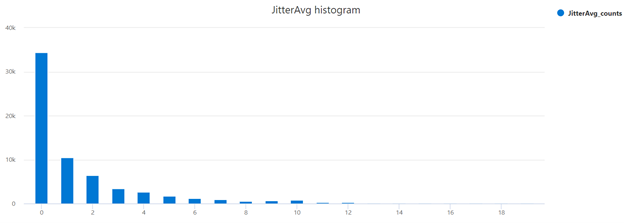
Histogram JitterAvg
// Jitter Average Histogram
ACSCallDiagnostics
| where isnotnull(JitterAvg)
| summarize JitterAvg_counts=count() by JitterAvg
| order by JitterAvg asc
| render columnchart with (xcolumn = JitterAvg, title="JitterAvg histogram")
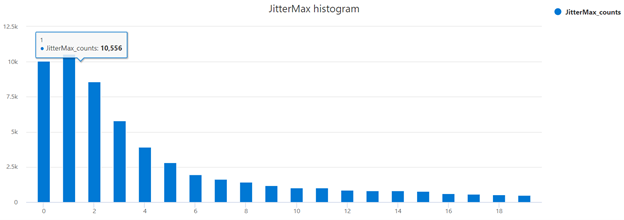
Histogram JitterMax
// Jitter Max Histogram
ACSCallDiagnostics
| where isnotnull(JitterMax)
|summarize JitterMax_counts=count() by JitterMax
| order by JitterMax asc
| render columnchart with (xcolumn = JitterMax, title="JitterMax histogram")
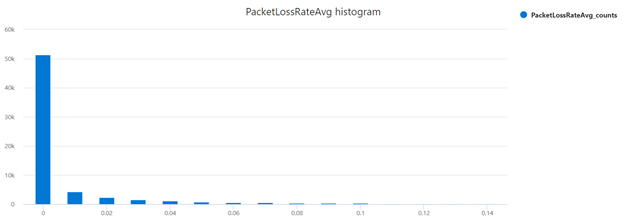
Histogram średniego wskaźnika utraty pakietów (PacketLossRateAvg)
// PacketLossRate Average Histogram
ACSCallDiagnostics
| where isnotnull(PacketLossRateAvg)
|summarize PacketLossRateAvg_counts=count() by bin(PacketLossRateAvg, 0.01)
| order by PacketLossRateAvg asc
| render columnchart with (xcolumn = PacketLossRateAvg, title="PacketLossRateAvg histogram")
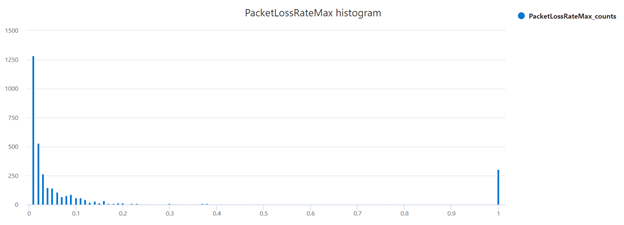
Histogram maksymalnej wartości utraty pakietów
// PacketLossRate Max Histogram
ACSCallDiagnostics
| where isnotnull(PacketLossRateMax)
|summarize PacketLossRateMax_counts=count() by bin(PacketLossRateMax, 0.01)
| order by PacketLossRateMax asc
| render columnchart with (xcolumn = PacketLossRateMax, title="PacketLossRateMax histogram")
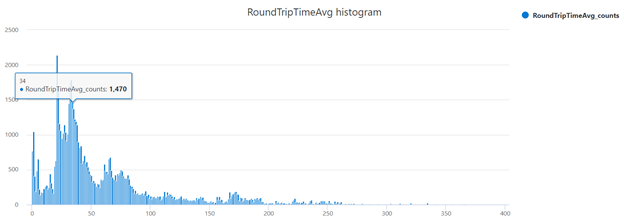
Histogram średniego czasu RoundTripTime
// RoundTripTime Average Histogram
ACSCallDiagnostics
| where isnotnull(RoundTripTimeAvg)
|summarize RoundTripTimeAvg_counts=count() by RoundTripTimeAvg
| order by RoundTripTimeAvg asc
| render columnchart with (xcolumn = RoundTripTimeAvg, title="RoundTripTimeAvg histogram")
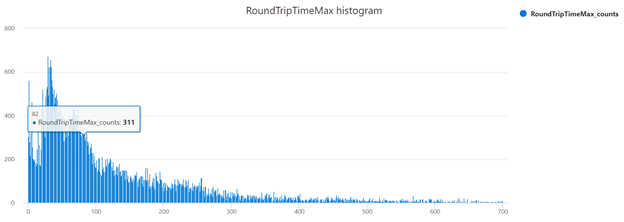
Histogram maksymalnego czasu przelotu
// RoundTripTime Max Histogram
ACSCallDiagnostics
| where isnotnull(RoundTripTimeMax)
|summarize RoundTripTimeMax_counts=count() by RoundTripTimeMax
| order by RoundTripTimeMax asc
| render columnchart with (xcolumn = RoundTripTimeMax, title="RoundTripTimeMax histogram")
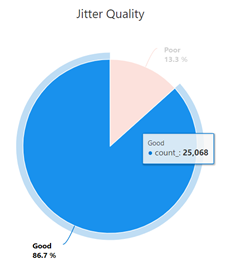
Niska jakość jittera
// Get proportion of calls with poor quality jitter
// (defined as jitter being higher than 30ms)
ACSCallDiagnostics
| extend JitterQuality = iff(JitterAvg > 30, "Poor", "Good")
| summarize count() by JitterQuality
| render piechart title="Jitter Quality"
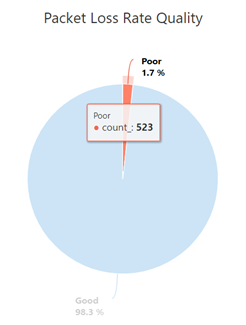
Jakość wskaźnika utraty pakietów
// Get proportion of calls with poor quality packet loss
// rate (defined as packet loss being higher than 10%)
ACSCallDiagnostics
| extend PacketLossRateQuality = iff(PacketLossRateAvg > 0.1, "Poor", "Good")
| summarize count() by PacketLossRateQuality
| render piechart title="Packet Loss Rate Quality"
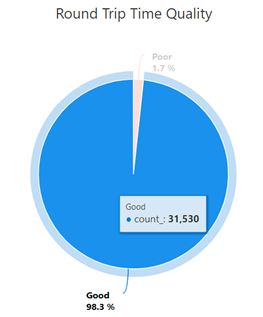
Jakość RoundTripTime
// Get proportion of calls with poor quality packet loss
// rate (defined as packet loss being higher than 10%)
ACSCallDiagnostics
| extend PacketLossRateQuality = iff(PacketLossRateAvg > 0.1, "Poor", "Good")
| summarize count() by PacketLossRateQuality
| render piechart title="Packet Loss Rate Quality"
Zapytania z możliwością parametrów
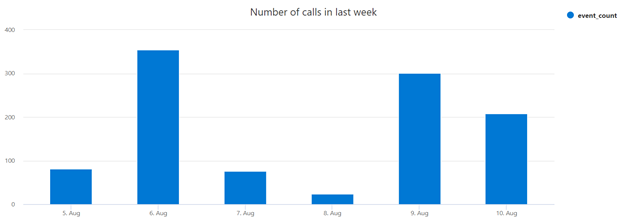
Codzienne połączenia w ciągu ostatniego tygodnia
// Histogram of daily calls over the last week
ACSCallSummary
| where CallStartTime > now() - 7d
| distinct CorrelationId, CallStartTime
| extend hour  = floor(CallStartTime, 1d)
| summarize event_count=count() by day
| sort by day asc
| render columnchart title="Number of calls in last week"
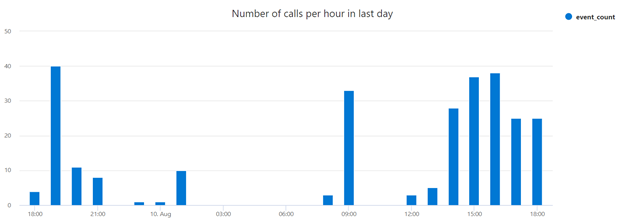
Połączenia na godzinę w ciągu ostatniego dnia
// Histogram of calls per hour in the last day
ACSCallSummary
| where CallStartTime > now() - 1d
| distinct CorrelationId, CallStartTime
| extend hour = floor(CallStartTime, 1h)
| summarize event_count=count() by hour
| sort by hour asc
| render columnchart title="Number of calls per hour in last day"