series_fit_lowess_fl()
Funkcja series_fit_lowess_fl() jest funkcją zdefiniowaną przez użytkownika (UDF), która stosuje regresję LOWESS w serii. Ta funkcja przyjmuje tabelę z wieloma seriami (dynamiczne tablice liczbowe) i generuje krzywą LOWESS, która jest gładką wersją oryginalnej serii.
Wymagania wstępne
- Wtyczka języka Python musi być włączona w klastrze. Jest to wymagane dla wbudowanego języka Python używanego w funkcji.
- Wtyczka języka Python musi być włączona w bazie danych. Jest to wymagane dla wbudowanego języka Python używanego w funkcji.
Składnia
T | invoke series_fit_lowess_fl(, y_series, y_fit_series [ fit_size ], [ x_series ], [ x_istime ])
Dowiedz się więcej o konwencjach składniowych.
Parametry
| Nazwa | Typ | Wymagane | Opis |
|---|---|---|---|
| y_series | string |
✔️ | Nazwa kolumny tabeli wejściowej zawierającej zmienną zależną. Ta kolumna jest serią do dopasowania. |
| y_fit_series | string |
✔️ | Nazwa kolumny do przechowywania dopasowanej serii. |
| fit_size | int |
Dla każdego punktu regresja lokalna jest stosowana na odpowiednich fit_size najbliższych punktach. Wartość domyślna to 5. | |
| x_series | string |
Nazwa kolumny zawierającej zmienną niezależną, czyli oś x lub time. Ten parametr jest opcjonalny i jest potrzebny tylko dla nierównomiernie rozmieszczonych serii. Wartość domyślna to pusty ciąg, ponieważ x jest nadmiarowy dla regresji równomiernie rozmieszczonej serii. | |
| x_istime | bool |
Ten parametr logiczny jest wymagany tylko wtedy, gdy określono x_series i jest to wektor daty/godziny. Wartość domyślna to false. |
Definicja funkcji
Funkcję można zdefiniować, osadzając kod jako funkcję zdefiniowaną przez zapytanie lub tworząc ją jako funkcję przechowywaną w bazie danych w następujący sposób:
Zdefiniuj funkcję przy użyciu następującej instrukcji let. Nie są wymagane żadne uprawnienia.
Ważne
Instrukcja let nie może być uruchamiana samodzielnie. Należy po nim wykonać instrukcję wyrażenia tabelarycznego. Aby uruchomić działający przykład programu series_fit_lowess_fl(), zobacz Przykłady.
let series_fit_lowess_fl=(tbl:(*), y_series:string, y_fit_series:string, fit_size:int=5, x_series:string='', x_istime:bool=False)
{
    let kwargs = bag_pack('y_series', y_series, 'y_fit_series', y_fit_series, 'fit_size', fit_size, 'x_series', x_series, 'x_istime', x_istime);
    let code = ```if 1:
        y_series = kargs["y_series"]
        y_fit_series = kargs["y_fit_series"]
        fit_size = kargs["fit_size"]
        x_series = kargs["x_series"]
        x_istime = kargs["x_istime"]
        import statsmodels.api as sm
        def lowess_fit(ts_row, x_col, y_col, fsize):
            y = ts_row[y_col]
            fraction = fsize/len(y)
            if x_col == "": # If there is no x column creates sequential range [1, len(y)]
               x = np.arange(len(y)) + 1
            else: # if x column exists check whether its a time column. If so, normalize it to the [1, len(y)] range, else take it as is.
               if x_istime:
                   x = pd.to_numeric(pd.to_datetime(ts_row[x_col]))
                   x = x - x.min()
                   x = x / x.max()
                   x = x * (len(x) - 1) + 1
               else:
                   x = ts_row[x_col]
            lowess = sm.nonparametric.lowess
            z = lowess(y, x, return_sorted=False, frac=fraction)
            return list(z)
        result = df
        result[y_fit_series] = df.apply(lowess_fit, axis=1, args=(x_series, y_series, fit_size))
    ```;
    tbl
     | evaluate python(typeof(*), code, kwargs)
};
// Write your query to use the function here.
Przykłady
W poniższych przykładach użyto operatora invoke , aby uruchomić funkcję.
Regresja LOWESS w regularnych szeregach czasowych
Aby użyć funkcji zdefiniowanej przez zapytanie, wywołaj ją po osadzonej definicji funkcji.
let series_fit_lowess_fl=(tbl:(*), y_series:string, y_fit_series:string, fit_size:int=5, x_series:string='', x_istime:bool=False)
{
let kwargs = bag_pack('y_series', y_series, 'y_fit_series', y_fit_series, 'fit_size', fit_size, 'x_series', x_series, 'x_istime', x_istime);
let code = ```if 1:
y_series = kargs["y_series"]
y_fit_series = kargs["y_fit_series"]
fit_size = kargs["fit_size"]
x_series = kargs["x_series"]
x_istime = kargs["x_istime"]
import statsmodels.api as sm
def lowess_fit(ts_row, x_col, y_col, fsize):
y = ts_row[y_col]
fraction = fsize/len(y)
if x_col == "": # If there is no x column creates sequential range [1, len(y)]
x = np.arange(len(y)) + 1
else: # if x column exists check whether its a time column. If so, normalize it to the [1, len(y)] range, else take it as is.
if x_istime:
x = pd.to_numeric(pd.to_datetime(ts_row[x_col]))
x = x - x.min()
x = x / x.max()
x = x * (len(x) - 1) + 1
else:
x = ts_row[x_col]
lowess = sm.nonparametric.lowess
z = lowess(y, x, return_sorted=False, frac=fraction)
return list(z)
result = df
result[y_fit_series] = df.apply(lowess_fit, axis=1, args=(x_series, y_series, fit_size))
```;
tbl
| evaluate python(typeof(*), code, kwargs)
};
//
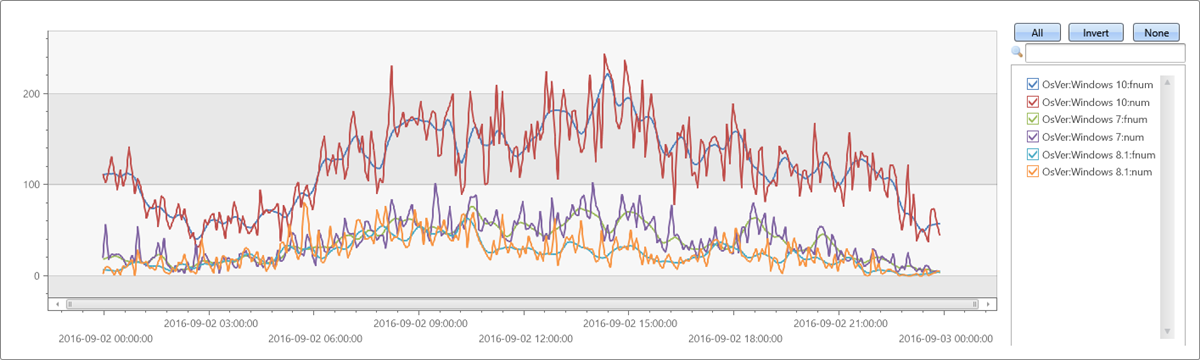
// Apply 9 points LOWESS regression on regular time series
//
let max_t = datetime(2016-09-03);
demo_make_series1
| make-series num=count() on TimeStamp from max_t-1d to max_t step 5m by OsVer
| extend fnum = dynamic(null)
| invoke series_fit_lowess_fl('num', 'fnum', 9)
| render timechart
Dane wyjściowe
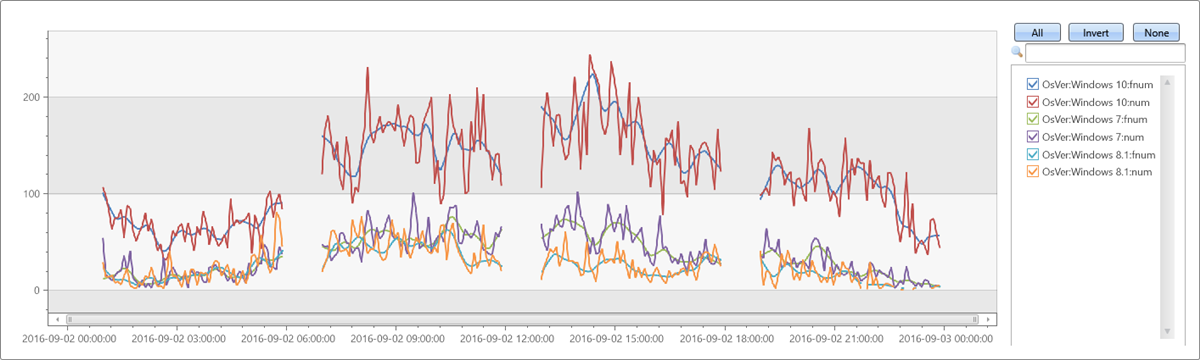
Testowanie nieregularnych szeregów czasowych
Aby użyć funkcji zdefiniowanej przez zapytanie, wywołaj ją po osadzonej definicji funkcji.
let series_fit_lowess_fl=(tbl:(*), y_series:string, y_fit_series:string, fit_size:int=5, x_series:string='', x_istime:bool=False)
{
    let kwargs = bag_pack('y_series', y_series, 'y_fit_series', y_fit_series, 'fit_size', fit_size, 'x_series', x_series, 'x_istime', x_istime);
    let code = ```if 1:
        y_series = kargs["y_series"]
        y_fit_series = kargs["y_fit_series"]
        fit_size = kargs["fit_size"]
        x_series = kargs["x_series"]
        x_istime = kargs["x_istime"]
        import statsmodels.api as sm
        def lowess_fit(ts_row, x_col, y_col, fsize):
            y = ts_row[y_col]
            fraction = fsize/len(y)
            if x_col == "": # If there is no x column creates sequential range [1, len(y)]
               x = np.arange(len(y)) + 1
            else: # if x column exists check whether its a time column. If so, normalize it to the [1, len(y)] range, else take it as is.
               if x_istime:
                   x = pd.to_numeric(pd.to_datetime(ts_row[x_col]))
                   x = x - x.min()
                   x = x / x.max()
                   x = x * (len(x) - 1) + 1
               else:
                   x = ts_row[x_col]
            lowess = sm.nonparametric.lowess
            z = lowess(y, x, return_sorted=False, frac=fraction)
            return list(z)
        result = df
        result[y_fit_series] = df.apply(lowess_fit, axis=1, args=(x_series, y_series, fit_size))
    ```;
    tbl
     | evaluate python(typeof(*), code, kwargs)
};
let max_t = datetime(2016-09-03);
demo_make_series1
| where TimeStamp between ((max_t-1d)..max_t)
| summarize num=count() by bin(TimeStamp, 5m), OsVer
| order by TimeStamp asc
| where hourofday(TimeStamp) % 6 != 0   //  delete every 6th hour to create irregular time series
| summarize TimeStamp=make_list(TimeStamp), num=make_list(num) by OsVer
| extend fnum = dynamic(null)
| invoke series_fit_lowess_fl('num', 'fnum', 9, 'TimeStamp', True)
| render timechart
Dane wyjściowe
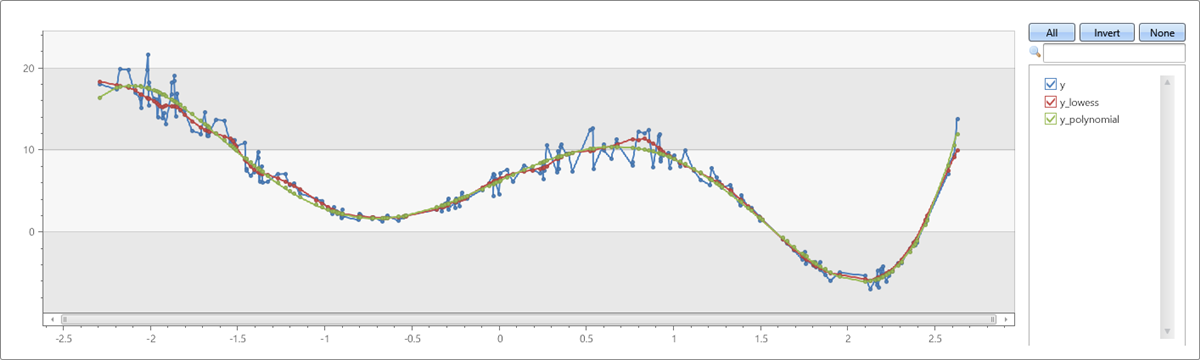
Porównanie dopasowania LOWESS i wielomianowego
Aby użyć funkcji zdefiniowanej przez zapytanie, wywołaj ją po osadzonej definicji funkcji.
let series_fit_lowess_fl=(tbl:(*), y_series:string, y_fit_series:string, fit_size:int=5, x_series:string='', x_istime:bool=False)
{
    let kwargs = bag_pack('y_series', y_series, 'y_fit_series', y_fit_series, 'fit_size', fit_size, 'x_series', x_series, 'x_istime', x_istime);
    let code = ```if 1:
        y_series = kargs["y_series"]
        y_fit_series = kargs["y_fit_series"]
        fit_size = kargs["fit_size"]
        x_series = kargs["x_series"]
        x_istime = kargs["x_istime"]
        import statsmodels.api as sm
        def lowess_fit(ts_row, x_col, y_col, fsize):
            y = ts_row[y_col]
            fraction = fsize/len(y)
            if x_col == "": # If there is no x column creates sequential range [1, len(y)]
               x = np.arange(len(y)) + 1
            else: # if x column exists check whether its a time column. If so, normalize it to the [1, len(y)] range, else take it as is.
               if x_istime:
                   x = pd.to_numeric(pd.to_datetime(ts_row[x_col]))
                   x = x - x.min()
                   x = x / x.max()
                   x = x * (len(x) - 1) + 1
               else:
                   x = ts_row[x_col]
            lowess = sm.nonparametric.lowess
            z = lowess(y, x, return_sorted=False, frac=fraction)
            return list(z)
        result = df
        result[y_fit_series] = df.apply(lowess_fit, axis=1, args=(x_series, y_series, fit_size))
    ```;
    tbl
     | evaluate python(typeof(*), code, kwargs)
};
range x from 1 to 200 step 1
| project x = rand()*5 - 2.3
| extend y = pow(x, 5)-8*pow(x, 3)+10*x+6
| extend y = y + (rand() - 0.5)*0.5*y
| summarize x=make_list(x), y=make_list(y)
| extend y_lowess = dynamic(null)
| invoke series_fit_lowess_fl('y', 'y_lowess', 15, 'x')
| extend series_fit_poly(y, x, 5)
| project x, y, y_lowess, y_polynomial=series_fit_poly_y_poly_fit
| render linechart
Dane wyjściowe
Ta funkcja nie jest obsługiwana.
Opinia
Dostępne już wkrótce: W 2024 r. będziemy stopniowo wycofywać zgłoszenia z serwisu GitHub jako mechanizm przesyłania opinii na temat zawartości i zastępować go nowym systemem opinii. Aby uzyskać więcej informacji, sprawdź: https://aka.ms/ContentUserFeedback.
Prześlij i wyświetl opinię dla