Uwaga
Dostęp do tej strony wymaga autoryzacji. Może spróbować zalogować się lub zmienić katalogi.
Dostęp do tej strony wymaga autoryzacji. Możesz spróbować zmienić katalogi.
Ważne
Od 2/26/2025 usługa MedTech nie będzie już dostępna w następujących regionach: Zachodnie Zjednoczone Królestwo, Zjednoczone Emiraty Arabskie, Republika Południowej Afryki Północnej, Katar Środkowy.
In this article, learn how to use the MedTech service monitoring and health check tabs in the Azure portal. The monitoring and health check tabs provide access to crucial MedTech service metrics and health checks. These metrics and health checks can be used in assessing the health and performance of your MedTech service and can be useful seeing patterns and/or trends or assisting with troubleshooting your MedTech service.
Use the MedTech service monitoring tab
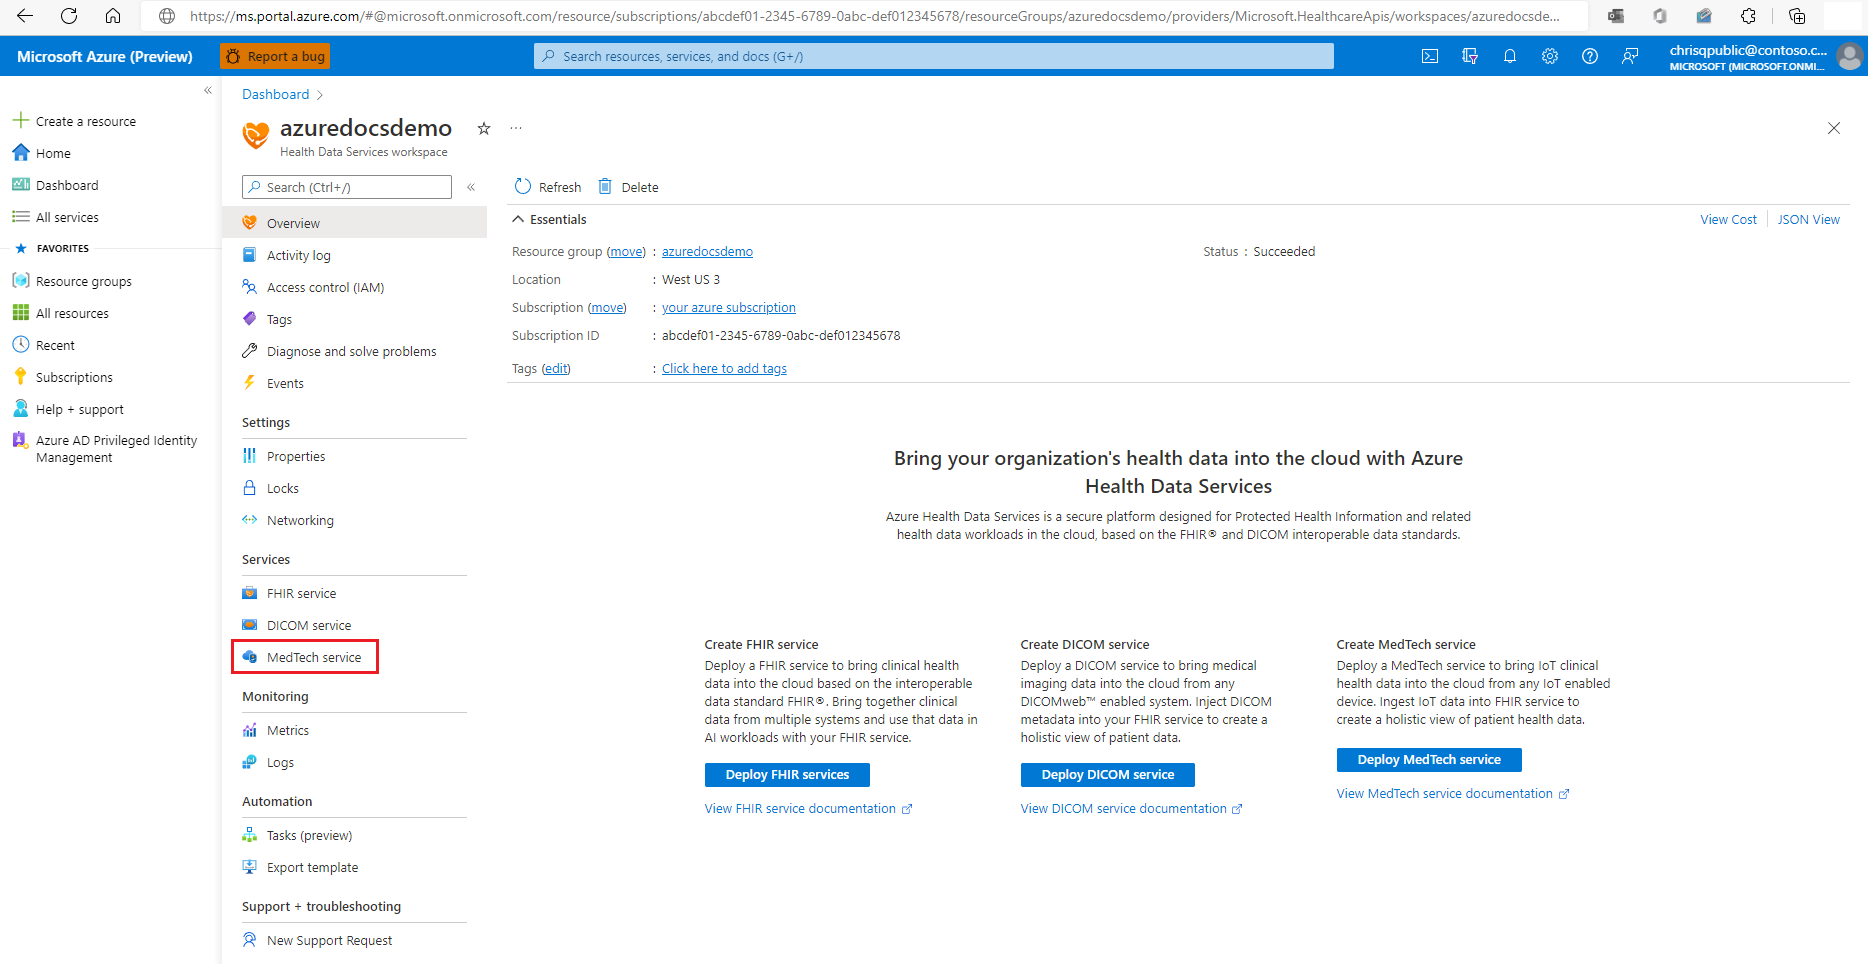
Within your Azure Health Data Services workspace, select MedTech service under Services.
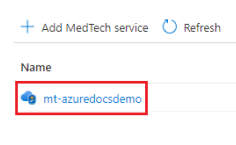
Select the MedTech service that you would like to display metrics for. For this example, we'll select a MedTech service named mt-azuredocsdemo. Wybierzesz usługę MedTech we własnym obszarze roboczym usług Azure Health Data Services.
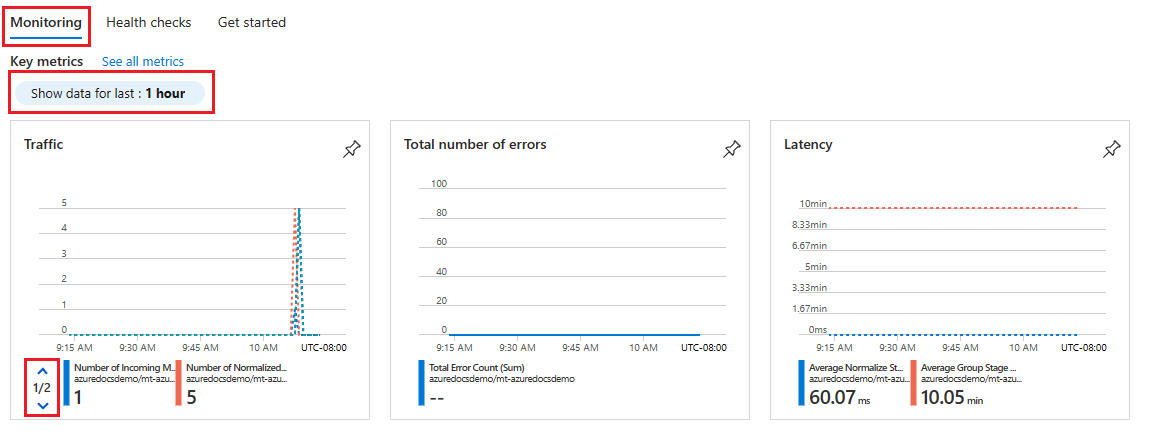
The MedTech service monitoring tab opens, displaying a subset of the supported MedTech service metrics. By default, the Show data for last option is set to 1 hour. To adjust the time duration, select the Show data for last option, select the time period you would like to view, and select Apply. Select the down arrow in the Traffic MedTech service metrics tile to display the next set of MedTech service traffic metrics.
Ważne
If you leave the MedTech service monitoring tab, any customized settings you have made to the monitoring settings are lost and will have to be recreated. If you would like to save your customizations for future viewing, you can pin them to an Azure portal dashboard as a tile.
To learn how to customize and save metrics settings to an Azure portal dashboard and tile, see How to configure the MedTech service metrics.
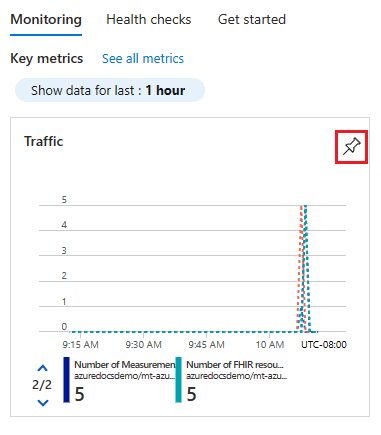
Optional - Select the pin icon to save the metrics tile to an Azure portal dashboard of your choosing.
Tip
Aby dowiedzieć się więcej na temat zaawansowanych opcji wyświetlania i udostępniania metryk, zobacz Analizowanie metryk za pomocą Eksploratora metryk usługi Azure Monitor.


Available metrics for the MedTech service
This table shows the available MedTech service metrics and the information that the metrics are capturing. The metrics in bold are the metrics displayed within the Monitoring tab:
| Metric category | Metric name | Metric description |
|---|---|---|
| Dostępność | Stan kondycji IotConnector | Ogólna kondycja usługi MedTech. |
| Błędy | Total Error Count | Całkowita liczba błędów. |
| Opóźnienie | Average Group Stage Latency | Średnie opóźnienie etapu grupowego. Etap grupy wykonuje buforowanie, agregowanie i grupowanie znormalizowanych komunikatów. |
| Opóźnienie | Average Normalize Stage Latency | Średnie opóźnienie znormalizowanego etapu. Znormalizowany etap wykonuje normalizację nieprzetworzonych komunikatów przychodzących. |
| Ruch | Number of Fhir resources saved | Całkowita liczba zasobów FHIR® zaktualizowanych lub utrwalonych przez usługę MedTech. |
| Ruch | Number of Incoming Messages | Liczba odebranych nieprzetworzonych komunikatów przychodzących (na przykład zdarzeń urządzenia) ze skonfigurowanego źródłowego centrum zdarzeń. |
| Ruch | Number of Measurements | The number of normalized value readings received by the FHIR transformation stage of the MedTech service. |
| Ruch | Number of Message Groups | Liczba grup, które mają komunikaty zagregowane w wyznaczonym przedziale czasu. |
| Ruch | Number of Normalized Messages | The number of normalized messages. |
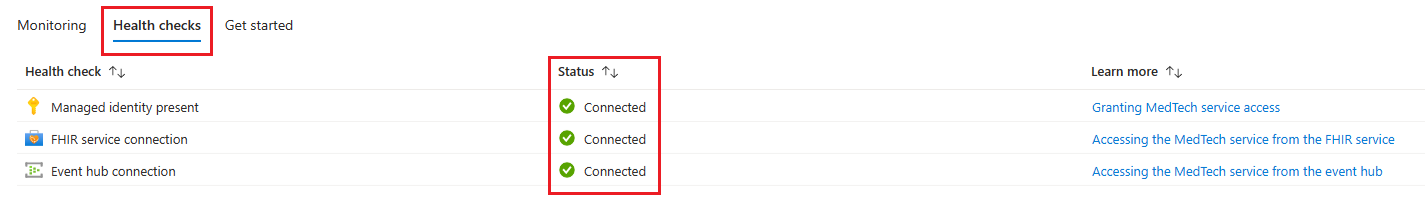
Use the MedTech service health checks tab
Select the Health checks tab within your MedTech service to display the health checks. In the example, the MedTech service is passing all health checks as indicated by the Status row and the Connected status.
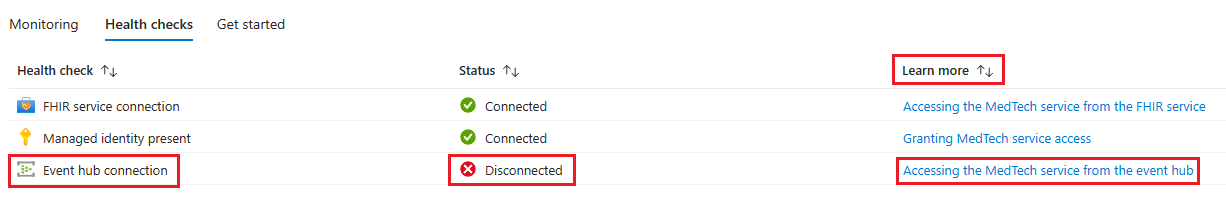
In this example, we can see that the MedTech service is indicating that the Health check for Event hub connection is showing a Status of Disconnected. To find out how to troubleshoot this failed health check, you can select the Accessing the MedTech service from the event hub link under the Learn more row to be directed to the MedTech service troubleshooting guide section for addressing this failed health check.


Następne kroki
How to configure the MedTech service metrics
How to enable diagnostic settings for the MedTech service
Uwaga
FHIR® jest zastrzeżonym znakiem towarowym HL7 i jest używany z uprawnieniem HL7.