Tutorial: Add parameters to your report (Report Builder)
You can add parameters to Reporting Services paginated reports with Report Builder in SQL Server Reporting Services (SSRS) to enable report readers to filter data for specific values. Report parameters are created automatically for each query parameter you include in a dataset query. The parameter data type determines how it appears on the report view toolbar.
The following image shows a paginated report with data filtered according to selected parameters:

In this tutorial, you:
- Create a paginated report with an embedded data source and query
- Use query parameters to create report parameters and configure properties
- Work with datasets to control the visible data for report parameters
- Define default values and custom values for parameters
The estimated time to complete this tutorial is 25 minutes.
Note
The following procedures provide brief instructions for working with Report Builder. In some cases, several wizard actions are consolidated into a single step. For detailed step-by-step instructions with screenshots, see Tutorial: Create a basic table report (Report Builder). The article describes how to browse to a report server, choose a data source, create a dataset, and more.
Prerequisites
For information about requirements, see Prerequisites for tutorials (Report Builder).
Create report with Table or Matrix Wizard
Follow these steps to create a paginated (matrix) report by using the Table or Matrix wizard:
Start Report Builder from your computer, the Reporting Services web portal, or SharePoint integrated mode.
The New Report or Dataset dialog opens. If the dialog doesn't open, select File > New.
Select the New Report tab, and select Table or Matrix Wizard on the right pane.
On the Choose a dataset page, select the Create a dataset option, and then select Next.
On the Choose a connection to a data source page, select a data source. You can select a data source from the dropdown list, or browse to the report server and select a source. The data source must be of type SQL Server.
On the General tab, select Test Connection to verify you can connect to the data source.
You should see a popup message: "Connection created successfully." Select OK to clear the popup message.
To complete the data source setup, select OK, and then select Next.
On the Design a query page, select Edit As Text.
On the Query Designer dialog, paste the following Transact-SQL query into the top box:
;WITH CTE (StoreID, Subcategory, Quantity)
AS (
SELECT 200 AS StoreID, 'Digital SLR Cameras' AS Subcategory, 2002 AS Quantity
UNION SELECT  200 AS StoreID, 'Camcorders' AS Subcategory, 1954 AS Quantity
UNION SELECT  200 AS StoreID, 'Accessories' AS Subcategory, 1895 AS Quantity
UNION SELECT  199 AS StoreID, 'Digital Cameras' AS Subcategory, 1849 AS Quantity
UNION SELECT  306 AS StoreID, 'Digital SLR Cameras' AS Subcategory, 1579 AS Quantity
UNION SELECT  306 AS StoreID, 'Camcorders' AS Subcategory, 1561 AS Quantity
UNION SELECT  306 AS StoreID, 'Digital Cameras' AS Subcategory, 1553 AS Quantity
UNION SELECT  306 AS StoreID, 'Accessories' AS Subcategory, 1534 AS Quantity
UNION SELECT 307 AS StoreID, 'Accessories' AS Subcategory, 1755 AS Quantity
UNION SELECT 307 AS StoreID, 'Camcorders' AS Subcategory, 1631 AS Quantity
UNION SELECT 307 AS StoreID, 'Digital SLR Cameras' AS Subcategory, 1772 AS Quantity)
SELECT StoreID, Subcategory, Quantity
FROM CTE
This query combines the results of several Transact-SQL SELECT statements inside a common table expression. The expression specifies values based on simplified sales data for cameras from the Contoso sample database. The subcategories are digital cameras, digital single lens reflex (SLR) cameras, camcorders, and accessories.
On the Query Designer toolbar, select Run (!).
The query runs and displays the result set for the fields StoreID, Subcategory, and Quantity.
The result set consists of 11 rows of data that show the quantity of items sold for each subcategory for four stores. The store name isn't part of the result set. Later in this tutorial, you look up the name of the store that corresponds to the store identifier from a separate dataset.
This query doesn't contain query parameters. You add query parameters later in this tutorial.
To continue in the wizard, select Next.
Format the report layout and add totals
The wizard provides an initial design for displaying the data in the report. In the following procedure, you organize the Quantity sold values in rows grouped by Subcategory, with one column for each StoreID. The preview pane helps you visualize the result of grouping data before you complete the report design.
Organize table data into groups on the Arrange fields page:
From the Available fields box, drag the Subcategory field to the Row groups box.
Drag the StoreID field to the Column groups box.
Drag the Quantity field to the Values box.
The Sum function automatically aggregates the Quantity data, which is the default aggregate for numeric fields. The value is
[Sum(Quantity)].To continue in the wizard, select Next.
On the Choose the layout page, under Options, select the Show subtotals and grand totals option.
When you run the report, the last column shows the total Quantity of each Subcategory for all stores (StoreID). The last row shows the total Quantity for all Subcategories for each store (StoreID).
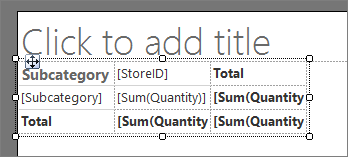
Select Next to check the table in the Preview pane. You should see three rows that demonstrate the table layout when you run the report:
The first row repeats once for the table to show the column headings.
The second row repeats once for each StoreID to show the quantity of items sold, and the quantity for each subcategory.
The third row repeats once to show the total quantity of items sold and total quantity by subcategory for all stores.
Select Finish.
Report Builder adds your matrix to the design surface. The table has three rows and three columns: Subcategory, [StoreID], and Total.
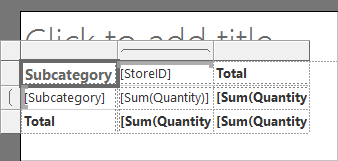
Increase the table width, so the Subcategory data can display on a single line in the report:
On the design surface, select in your matrix to display the row and column handles. The handles appear as gray bars along the edges of the table.
Point to the line between the Subcategory and StoredID columns to display the double arrow cursor.

Select and drag the line to increase the width for the Subcategory column:
On the Home tab, select Run to preview your report.
The report runs on the report server and displays the time the report processing occurred:
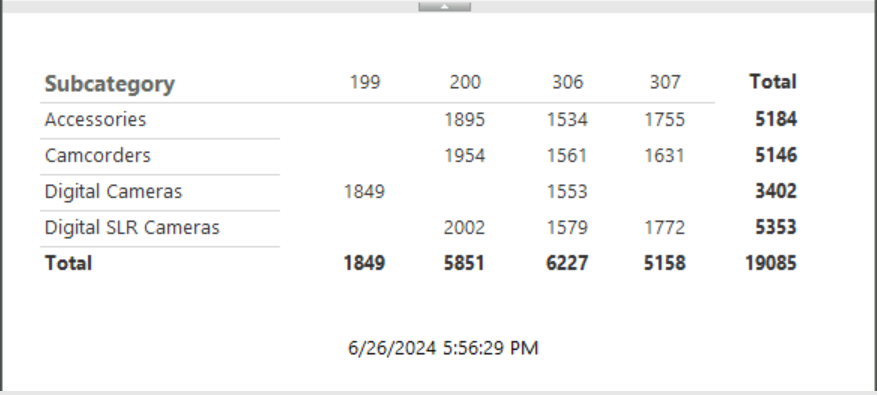
In the current matrix design, the column headings display the store identifier but not the store name. Later, you add an expression to look up the store name in a dataset that contains store identifier/store name pairs.
Create query parameters, report parameters, and configure properties
In the Query Designer, you can edit your query and add parameters. When you add a query parameter, Report Builder automatically creates a single-valued parameter to your report. Each parameter has several properties with default values, such as the name, prompt, and data type. You can configure these properties according to your report requirements.
Add query parameters and create report parameters
When you add a query parameter to a query, Report Builder automatically creates a single-valued report parameter with default properties for the name, prompt, and data type.
Follow these steps to add a query parameter:
On the Run tab, select Design to return to design view.
In the Report Data pane, expand the Datasets folder. Right-click DataSet1, and then select Query.
The Query Designer dialog opens. The existing query is visible in the top box on the dialog.
Use the separator bar between the two boxes on the dialog and increase the size of the top box.
Scroll to the bottom in the top box so the last line of the query is visible.
Select Enter to add a new line to the end of the query.
Paste the following Transact-SQL
WHEREclause into the last line of the query:WHERE StoreID = (@StoreID)The
WHEREclause limits the retrieved data to the store identifier specified by the query parameter\@StoreID.On the Query Designer toolbar, select Run (!).
The Define Query Parameters dialog opens and prompts for a value for the query parameter
\@StoreID.Tip
If you can't see the complete table cells and column headings, increase the size of the dialog.
In the Parameter Value box, enter 200, and then select OK:
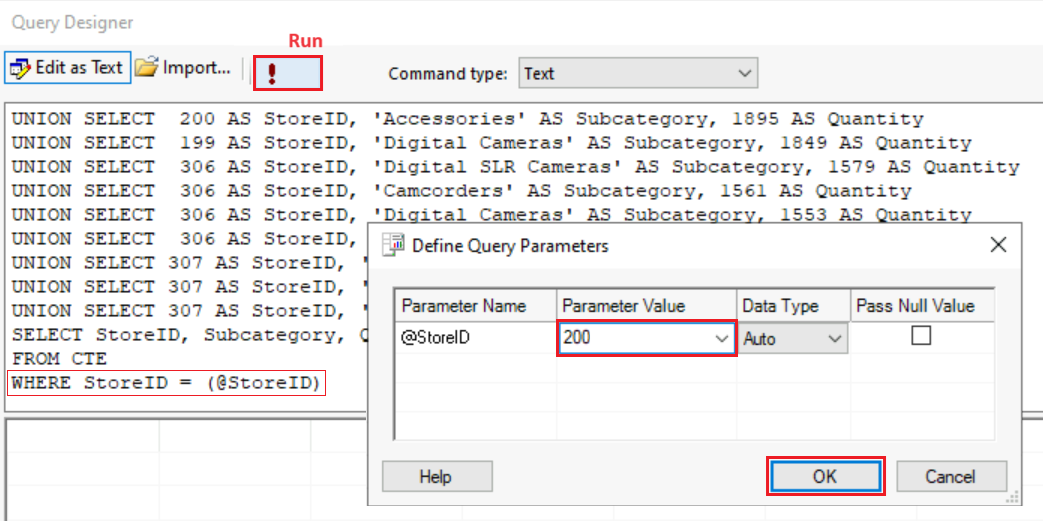
The result set displays the quantities sold for Accessories, Camcorders, and Digital SLR Cameras for the store identifier 200.
Select OK to close the Query Designer.
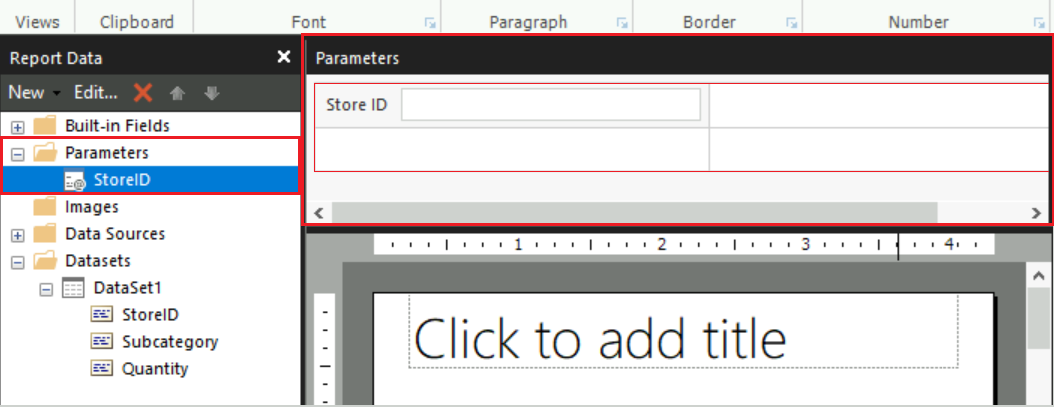
In the Report Data pane, expand the Parameters node:
The node now contains a report parameter named StoreID. When you select the parameter, the properties for the parameter display in the Parameters pane on the design surface. You can use this pane to format the layout of the report parameters.
Tip
If the Parameters pane isn't visible, select View and then select the Parameters checkbox.
Update properties for report parameters
After you create report parameters, you can adjust the property values for the parameter. In the tutorial example, the StoreID report parameter has the default data type Text. Because the store identifier is an integer, you can change the data type to Integer.
Change the data type for a report parameter by following these steps:
In the Report Data pane, under the Parameters node, right-click the StoreID parameter, and then select Parameter Properties.
In the Report Parameter Properties dialog, configure the following properties on the General tab:
Prompt: Enter Store identifier?. This prompt appears on the Report Viewer toolbar when you run the report.
Data type: Select Integer in the dropdown list. This setting configures the data type for input allowed at the prompt.
You can leave the other properties and options unchanged.
Select OK to apply your changes.
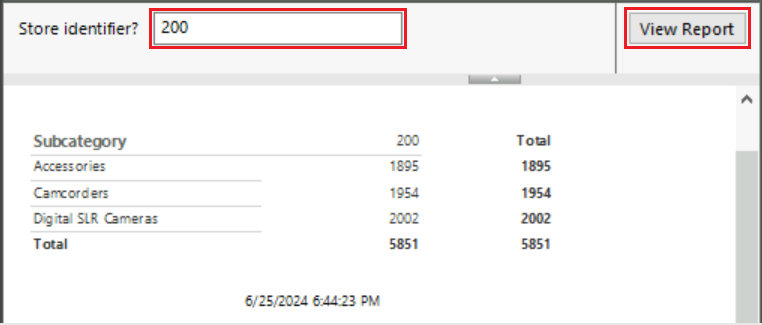
Select Run to preview the report. The report viewer now displays the prompt Store Identifier? as the value for the StoreID parameter.
On the Report Viewer toolbar, at the Store identifier? prompt, enter 200, and then select View Report:
Use datasets to provide values
You can make sure your report readers enter only valid values for a parameter by presenting them with a dropdown list of possible values. The set of values can come from a dataset or from a list that you specify. The available values must be supplied from a dataset with a query that doesn't contain a reference to the parameter.
Create dataset for valid parameter values
Follow these steps to create a dataset that lists valid values for a parameter:
On the Run tab, select Design to return to design view.
In the Report Data pane, right-click the Datasets node, and select Add Dataset.
In the Dataset Properties dialog, configure the following properties and options:
For the Name property, enter Stores.
Select the Use a dataset embedded in my report option.
Expand the Data source dropdown list, and select the data source specified earlier in this tutorial.
For the Query type property, verify that the Text option is selected.
In the Query box, paste the following query:
SELECT 200 AS StoreID, 'Contoso Catalog Store' as StoreName
UNION SELECT 199 AS StoreID, 'Contoso North America Online Store' as StoreName
UNION SELECT 307 AS StoreID, 'Contoso Asia Online Store' as StoreName
UNION SELECT 306 AS StoreID, 'Contoso Europe Online Store' as StoreName
Select OK to apply your changes.
The Report Data pane adds the Stores dataset under the Datasets node with the StoreID and StoreName properties.
Specify list of available values
After you have a dataset with available values, you can update the report properties to identify the dataset and property to populate the list of available values on the Report Viewer toolbar.
Provide available values for a parameter from a dataset by following these steps:
In the Report Data pane, under the Parameters node, right-click the StoreID parameter, and then select Parameter Properties.
In the Report Parameter Properties dialog, configure the following properties on the Available Values tab:
Select the Get values from a query option.
For the Dataset property, select Stores from the dropdown list.
For the Value field property, select StoreID from the dropdown list.
For the Label field property, select StoreName from the dropdown list. The label field specifies the display name for the value.
Switch to the General tab, and change the Prompt to Store name:.
Select OK to apply your changes.
Report readers now select from a list of store names instead of store identifiers. The parameter data type remains Integer because the parameter is based on the store identifier, not the store name.
Select Run to preview the report. The report viewer now displays the prompt Store name: as the value for the StoreID parameter.
In the Report Viewer toolbar, the prompt now presents a dropdown list with the initial value Select a Value:
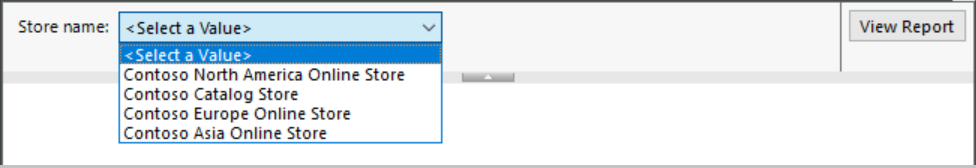
In the dropdown list, select Contoso Catalog Store, then choose View Report.
The report displays the quantity sold for Accessories, Camcorders, and Digital SLR Cameras for the store display name Contoso Catalog Store, which corresponds to store identifier 200.
Look up name/value pairs in datasets
A dataset might contain both the identifier parameter and the corresponding name parameter. If you have only an identifier value, you can look up the corresponding name in a dataset. For this approach, you need a dataset that you created that includes name/value pairs.
Follow these steps to look up a value for a name from a dataset:
On the Run tab, select Design to return to design view.
On the design surface, in the column header row in the matrix, right-click the
[StoreID]parameter, and then select Expression.In the Expression dialog, configure the following properties:
In the Set expression for: Value box at the top, delete all of the text.
In the Category box, expand the Common Functions node, and select Miscellaneous. The Item box updates to display a set of functions.
In the Item box, double-click Lookup. The top box updates to display the expression
=Lookup(. The Example box shows an example of theLookupfunction syntax.In the top box, paste the following expression:
=Lookup(Fields!StoreID.Value,Fields!StoreID.Value,Fields!StoreName.Value,"Stores")The
Lookupfunction takes the value for the StoreID report parameter, looks it up in the Stores dataset, and returns the value of the StoreName parameter.
Select OK to apply your changes.
The column header changes to a complex expression, <<Expr>>.
Select Run to preview the report.
In the report preview, the column header at the top of each column now displays the store name instead of the store identifier.
Configure default and custom values
You can configure default values for report parameters so the report runs automatically without prompting the reader for input. The default value for a parameter can be selected from an existing list of values or you can specify a custom value.
Specify default value from dataset
Follow these steps to configure default values by using a dataset:
On the Run tab, select Design to return to design view.
In the Report Data pane, under the Parameters node, right-click the StoreID parameter, and then select Parameter Properties.
In the Report Parameter Properties dialog, configure the following properties on the Default Values tab:
Select the Get values from a query option.
For the Dataset property, select Stores from the dropdown list.
For the Value field property, select StoreID from the dropdown list.
Select OK to apply your changes.
Select Run to preview the report.
The report now displays the prompt value Contoso North America Online Store by default because it's the first value in the result set for the Stores dataset. The report displays the quantity sold for Digital Cameras for store identifier 199, which corresponds to the store display name Contoso North America Online Store.
Provide custom default value
You can also provide a custom value to use as the default value for the parameter:
On the Run tab, select Design to return to design view.
In the Report Data pane, under the Parameters node, right-click the StoreID parameter, and then select Parameter Properties.
In the Report Parameter Properties dialog, configure the following properties on the Default Values tab:
Select the Specify values option, and then select Add. A new value row is added to the Value box. The default value in the dropdown list is (Null).
In the dropdown box, enter 200.
Select OK to apply your changes.
Select Run to preview the report.
The report now displays the prompt value Contoso Catalog Store because it's the display name for store identifier 200. The report displays the quantity sold for Accessories, Camcorders, and Digital SLR Cameras for the store identifier 200.
Enhance your report with parameters
There are many ways you can work with report parameters to enhance your report. The following sections describe several customization techniques:
- Identify the parameters currently selected by the report reader
- Allow report readers to filter the report data
- Support multiple-value parameters in your report
- Add Boolean parameters for conditional visibility of report data
Show reader-selected parameters
When your report readers have questions about a report, it helps to know their current parameter selection. You can preserve user-selected values for each parameter in the report. One approach is to display the parameters in a text box in the page footer.
Follow these steps to display the selected parameter value with a label on the page footer:
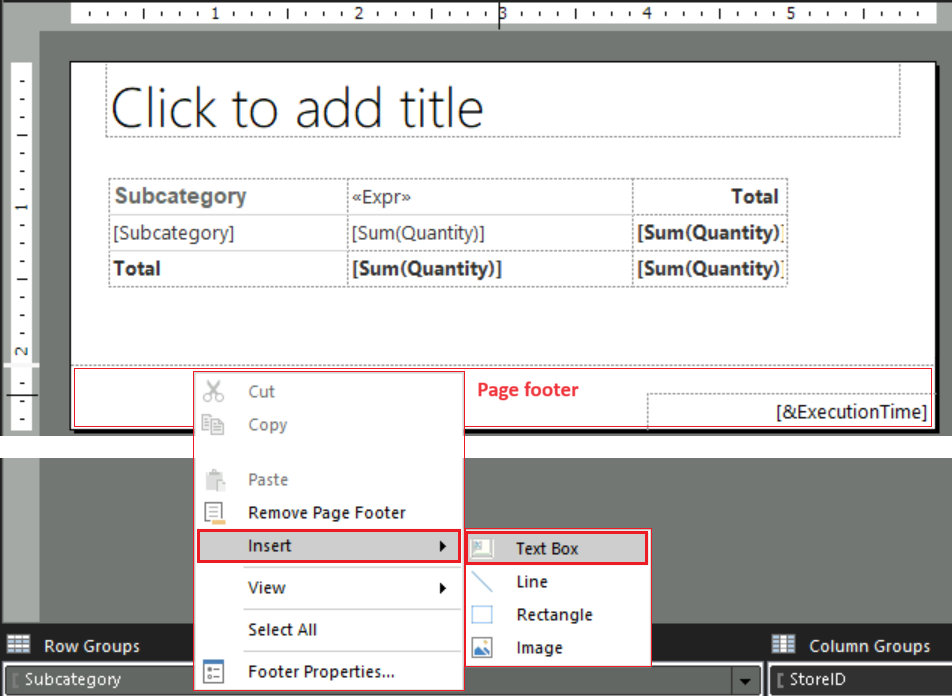
On the Run tab, select Design to return to design view.
Right-click the page footer, select Insert, and then select Text Box:
Drag the text box next to the text box with the time stamp. Use the side handle of the text box and expand the width.
From the Report Data pane, under the Parameters node, drag the StoreID parameter into the text box on the page footer. The text box updates to display the
[@StoreID]value.Update the text box to add a label for the parameter value:
Select in the text box until the insert cursor appears after the existing expression, and then enter a space.
Drag another copy of the StoreID parameter from the Report Data pane to the text box. The text box updates to display
[@StoreID] [@StoreID].In the text box, right-click the first
[StoreID]parameter, and then select Expression.In the Expression dialog, update the expression in the Set expression for: Value box at the top. Replace the text
Valuewith the textLabel.
Select OK to apply your changes.
The text box updates to display
[@StoreID.Label] [@StoreID].Select Run to preview the report.
The report now displays the name and identifier for the selected store in the page footer, along with the time stamp information.
Filter report data with parameters
Filters help control which data to use in a report after it comes from an external data source. To give readers control over the data they see in the report, you can include the report parameter in a filter for the matrix.
Specify a parameter in a matrix filter with these steps:
On the Run tab, select Design to return to design view.
In the report matrix, right-click a column header, and then select Tablix Properties.
In the Tablix Properties dialog, select the Filters tab, and then choose Add. A new filter row appears.
For the Expression property, select the StoreID dataset from the dropdown list. The data type box displays Integer. When the expression value is a dataset field, the data type is set automatically.
For the Operator property, verify the equals (=) symbol is selected.
For the Value property, enter [@StoreID].
[@StoreID]is the simple syntax that represents the longer expression=Parameters!StoreID.Value.
Select OK to apply your changes.
Select Run to preview the report.
The report displays data only for the Contoso Catalog Store.
On the Report viewer toolbar, in the Store name prompt, select Contoso Asia Online Store, and then choose View Report.
The matrix displays data that corresponds to the store that you selected.
Use multiple-value parameters
A multi-value parameter is an array of values. In a dataset query, the query syntax must test for inclusion of one value in a set of values. In a report expression, the expression syntax must access an array of values instead of an individual value.
If you change a parameter from single-value to multi-value, you also need to change the query and all expressions that contain a reference to the parameter, including filters.
Follow these steps to change an existing single-value parameter to support multiple values:
On the Run tab, select Design to return to design view.
In the Report Data pane, under the Parameters node, right-click the StoreID parameter, and then select Parameter Properties.
On the General tab, select the Allow multiple values option, and select OK.
Update the query to correctly process the values:
In the Report Data pane, in the Datasets node, right-click the DataSet1 dataset, and then select Query.
In the Query Designer dialog, scroll to the bottom of the query in the top box.
In the Transact-SQL
WHEREclause in the last line in the query, change the equals (=) symbol toIN:WHERE StoreID IN (@StoreID)The
INoperator tests a value for inclusion in a set of values.Select OK to apply the change.
Update the parameter filter to correctly handle multiple values:
In the report matrix, right-click a column header, and then select Tablix Properties.
In the Tablix Properties dialog, select the Filters tab.
For the Operator property, select In from the dropdown list.
Select OK to apply the change.
Update the page footer to properly display the multi-value parameter data:
In the page footer in the matrix, select the text box that displays the parameter.
Delete all the text in the text box.
Right-click the text box, and select Expression.
In the Expression dialog, paste the following expression in the top box:
=Join(Parameters!StoreID.Label, ", ")This expression concatenates all store names that the user selected, separated by a comma and a space.
Select OK to apply the change.
The text box in the page footer changes to a complex expression, <<Expr>>.
In the page footer, select in the text box and use the handles to increase the width of the box.
In the text box, position the cursor in front of the expression, and enter the text Parameter values selected:.
Select the label text Parameter values selected: and apply Bold format to the text. You can use the keyboard shortcut (Ctrl + B).
Check the report and test support for the multi-value parameter:
Select Run to preview the report.
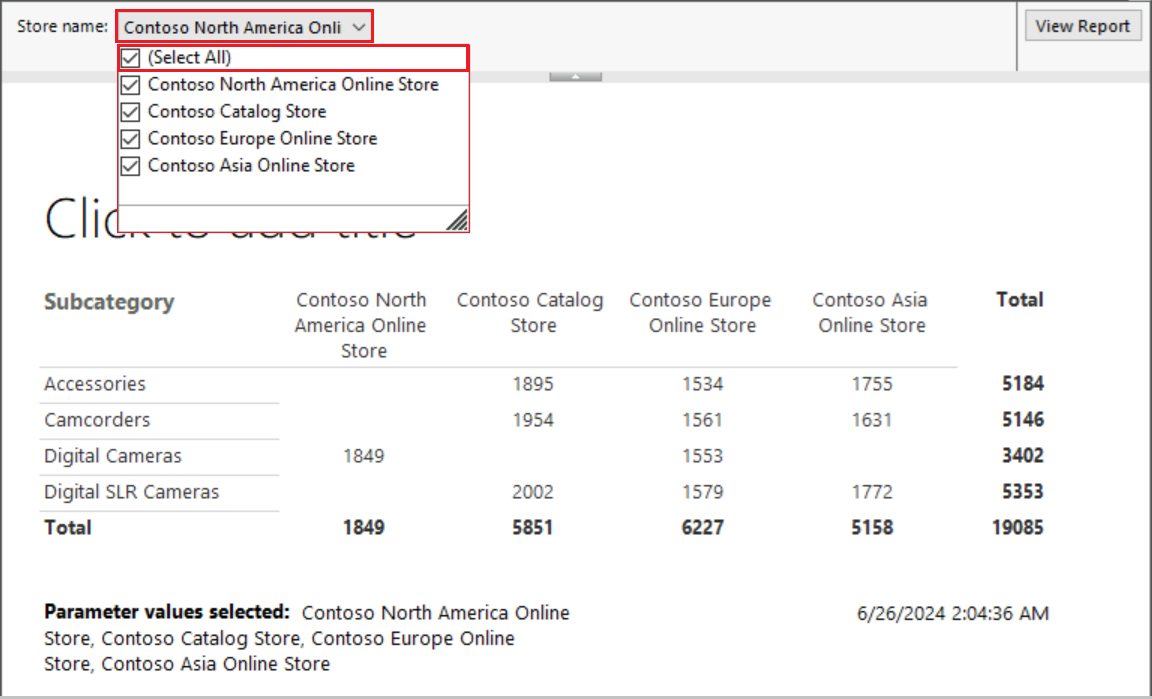
On the Report Viewer toolbar, at the Store name prompt, expand the dropdown list.
Each parameter value in the list has a check box. When the parameter value is included in the report view, the check box is selected.
In the dropdown list, choose the Select All option. This option selects all check boxes in the list, which causes all parameter values to display in the report.
On the Report Viewer toolbar, select View Report. The report displays the quantity sold for all subcategories for all stores:
Tip
For long parameter values, or wide reports with many columns, increase the report width or column widths on the design surface to improve the readability of the data in the report view. You can also adjust the formatting of column headings or cell data, such as by using Center alignment, so long values wrap in a readable form.
In the dropdown list, unselect the Select All option, and then select two values: Contoso Catalog Store and Contoso Asia Online Store.
Select View Report again to see the updated results.
Add Boolean parameters for conditional visibility
When you implement a Boolean (True or False) parameter in your report, you can control visibility of the parameter data based on the current setting.
Follow these steps to add a Boolean parameter to your report:
On the Run tab, select Design to return to design view.
In the Report Data pane, right-click the Parameters node, and select Add Parameter.
In the Report Parameter Properties dialog, configure the following properties on the General tab:
Name: Enter ShowSelections.
Prompt: Enter Show selections?.
Data type: Select Boolean in the dropdown list.
Switch to the Default Values tab, and configure the following properties:
Select the Specify value option, and then choose Add.
In the Value box, enter False.
Select OK to apply the property changes.
Now you can control the visibility based on the parameter setting:
In the page footer in the matrix, right-click the text box that displays the parameter, and select Text Box Properties.
In the Text Box Properties dialog, configure the following properties:
Select the Visibility tab.
Select the Show or hide based on an expression option.
Select the Expression option (Fx).
In the Expression dialog, paste the following expression in the top box:
=Not Parameters!ShowSelections.ValueThe Hidden property controls the text box Visibility option. When the Not (
!) operator is present and the reader selects the parameter, the Hidden property is False, and the text box displays the parameter data.Select OK to apply the expression.
Select OK again to apply the text box properties.
Check the report and test support for the Boolean parameter:
Select Run to preview the report.
On the Report Viewer toolbar, set the Show selections? option to True. Select View Report.
When the reader sets Show selections to True, the Parameter values selected information displays in the report.

Add report title
Add a title to the report with these steps:
In Report Builder, select Design to return to design view.
On the design surface, select the Click to add title text box.
In the Click to add title text box, enter the text Parameterized Product Sales, and then select outside the text box.
Save the report
Follow these steps to save the report on a report server:
Select File > Save As.
In the Save As Report dialog, select Recent Sites and Servers in the right pane.
Select or enter the name of the report server where you have permission to save reports.
The message "Connecting to report server" appears. When the connection completes, the default report folder opens. The report server administrator specifies the default folder location.
For the report Name, replace the default value Untitled with Parameterized_Product_Sales.
Select Save.
The report is saved to the report server. The status bar at the bottom of the window shows the name of the report server for the connection.
Related content
Opinia
Dostępne już wkrótce: W 2024 r. będziemy stopniowo wycofywać zgłoszenia z serwisu GitHub jako mechanizm przesyłania opinii na temat zawartości i zastępować go nowym systemem opinii. Aby uzyskać więcej informacji, sprawdź: https://aka.ms/ContentUserFeedback.
Prześlij i wyświetl opinię dla