Note
Access to this page requires authorization. You can try signing in or changing directories.
Access to this page requires authorization. You can try changing directories.
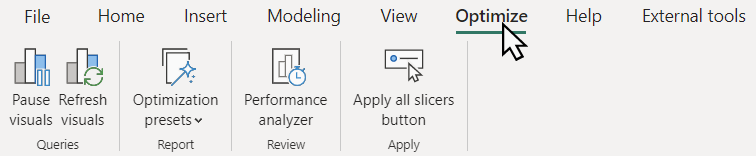
The Optimize ribbon in Power BI Desktop can improve report authoring performance by pausing data source queries when adding or changing visuals on the Report surface.
How you use features on the ribbon depends on the table data storage modes used in your model. For example:
- Visuals query local tables in Import mode.
- Visuals use DirectQuery mode to query table data at the data source.
- Options between import and DirectQuery modes, such as hybrid tables or semantic models with some tables in import mode and others in DirectQuery mode.
You can also create a report from an already published model from Power BI, Azure Analysis Services, or SQL Server Analysis Services using Live Connection or DirectQuery for Power BI semantic models and Analysis Services, where you may not know what storage mode the underlying tables are using.
The ribbon includes features that can be used for any report authoring scenario, however, DirectQuery reports in particular will find them most useful as queries are sent to the data source with most visual changes. DirectQuery report visuals that send queries to the data source can be identified in Performance analyzer.
The following sections describe features the Optimize ribbon provides. After reading this article, be sure to check out DirectQuery optimization scenarios with the Optimize ribbon to learn about how features in the Optimize ribbon and other performance improvements, such as being able to edit relationships in the Properties pane without running queries can streamline your DirectQuery report authoring.
Pause visuals
Typically, when authoring a report, you create a new visual or change an existing visual by adding or removing columns and measures to the visual's field well. When making changes like these, a DAX query is sent to the data source and the data in the visual is updated. You can see if DAX queries are being sent by using Performance analyzer. If making changes to visuals seems slow, you can stop those DAX queries to the data source by using Pause visuals in the Optimize ribbon. When paused, the entire report is paused. Instead of visuals sending DAX queries because of changes, visuals enter a Visual has pending changes state. No queries are sent to the data source until refreshed or the report is unpaused.
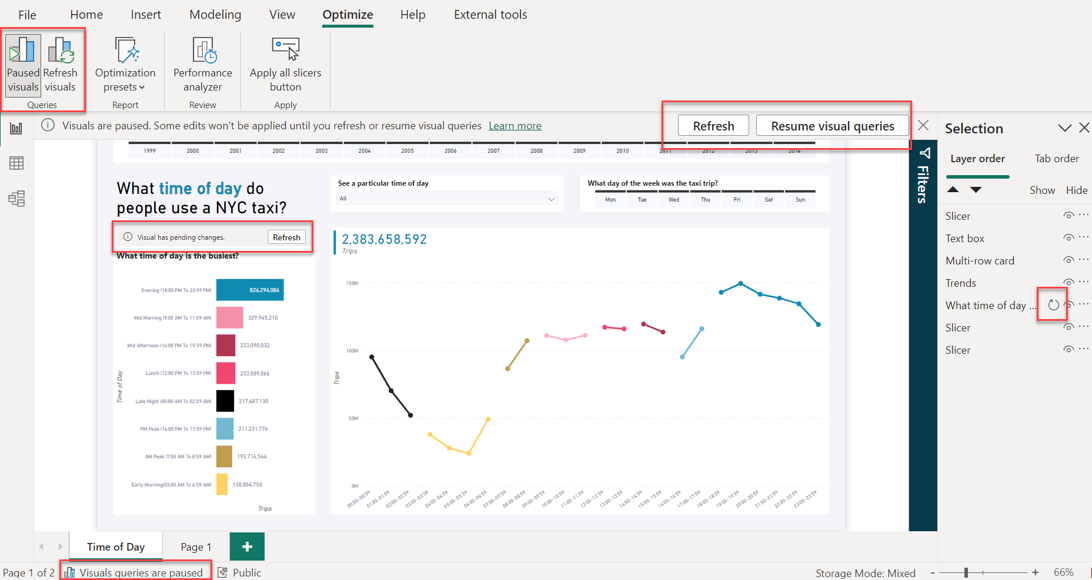
When paused, the report surface:
- Shows a banner with a Refresh button that refreshes all visuals in the report, and a Resume visual queries button that unpauses the Paused state.
- Individual visuals show a banner with a Refresh button allowing you to refresh that visual only. Other visuals in the report remain paused.
- Shows the visual's earlier state, if available, or remains empty.
- Visuals can have columns or measures added, moved, or removed, allowing you to make changes without having to wait for the visual to refresh or run queries with each change.
- Blocks formatting actions, as the formatting options are based on the data in the visual. Before the visual enters a pending state you can perform any formatting option and many such options will still show immediately. But if a formatting action such as conditional formatting requires the visual to run a query, the visual enters the pending state.
When done making changes to visuals, you can:
Select Refresh in the visual's Visual has pending changes banner to refresh only that visual and keep the rest of the report paused.
Select Refresh visuals in the Optimize ribbon, or Refresh in the report banner to refresh all visuals on the report and keep the report paused.
Select Resume visual queries in the report banner, or Paused visuals in the Optimize ribbon to refresh all visuals on the report and unpause the report.
When working with visuals in a pending state:
- Tooltips are disabled.
- The filter pane isn't affected.
- Automatic page refresh is paused but continues once visuals are resumed.
- The lower left status bar in Power BI Desktop shows Visuals queries are paused.
- The report banner stating visuals are paused can be closed, but the report remains paused until you select Paused visuals in the Optimize ribbon or Resume visual queries in the report banner.
- When saving and closing a Power BI Desktop file with the report paused, the report remains paused when reopened.
- Repeated actions such as adding a field that was added before may not trigger a visual pending state or take a visual out of the pending state. If there's a cache of data matching the visual configuration available, Power BI Desktop uses that data instead of sending a query.
To learn more about how pausing can help in real-world report authoring scenarios, see DirectQuery optimization scenarios - Change a DirectQuery report without running queries.
Refresh visuals
Select Refresh visuals in the Optimize ribbon or Refresh in the report banner to manually refresh all of the visuals in the report while keeping the report paused after the refresh has completed. Refreshing this way is effectively the same behavior as Refresh visuals on the Performance analyzer pane. To learn more, see Power BI refresh types.
Optimization presets
With Optimization presets, you can quickly choose and apply predefined combinations of settings tailored to your reporting scenario.
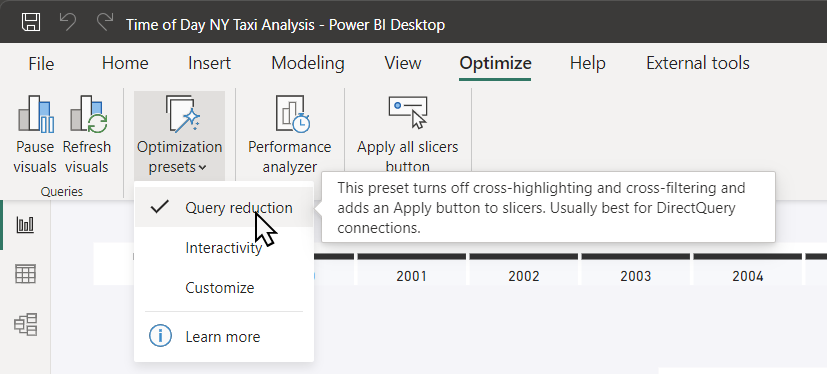
Optimization presets include:
Query reduction - Turns off cross-highlighting and cross-filtering and adds an Apply button to the filter pane. This setting is best for DirectQuery connections. The predefined combination of settings for query reduction follows the recommended best practices outlined in the report design guidance page for using DirectQuery. To learn about a scenario where applying query reduction settings affect report authoring, see DirectQuery optimization scenarios - Apply query reduction settings.
Interactivity - Allows cross-highlighting, cross-filtering, and real-time changes to slicers and filters, which is best for import mode. This is the default setting for Power BI Desktop.
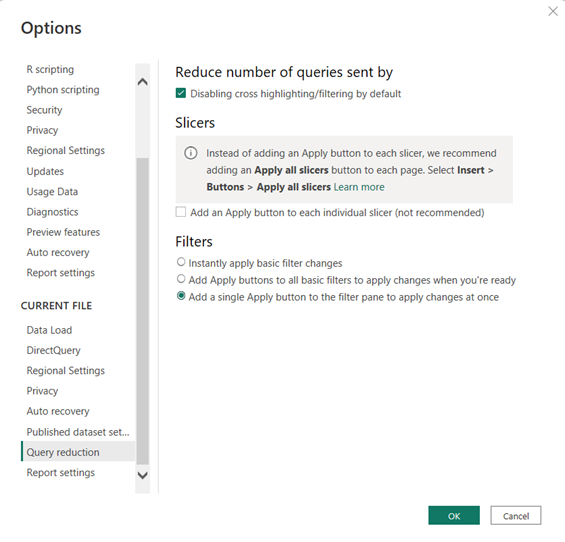
Customize - Opens the Query reduction settings of the Power BI Desktop Options dialog. You can choose which query reduction features you want to use. To learn more about how applying query reduction settings affect a report authoring scenario, see DirectQuery optimization scenarios - Change query reduction settings.
Performance analyzer
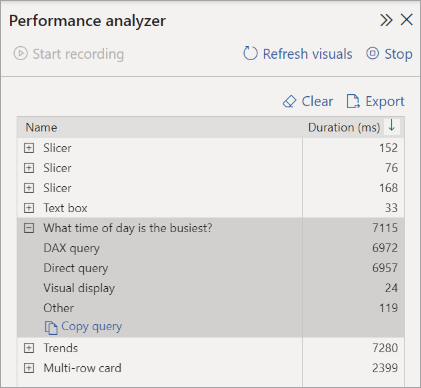
The Optimize ribbon includes the same Performance analyzer button as shown in the View ribbon. When using Performance analyzer, you can see and record logs that measure how each of your report elements performs during interaction, and which aspects of their performance are most (or least) resource intensive. Using Performance analyzer can also help you determine if a particular visual is using DirectQuery. DirectQuery visuals have a Direct query row.
To learn more, see Use Performance analyzer to examine report element performance.
Create Apply all and Clear all slicers buttons
If a report page has a number of slicers, consider adding Apply all slicers and Clear all slicers buttons to the page. These buttons apply all the slicers or clear all the slicers on a page with one click, reducing the number of unnecessary visual queries the slicers send. To learn more, see Create Apply all and Clear all slicers buttons in Power BI reports.