Note
Access to this page requires authorization. You can try signing in or changing directories.
Access to this page requires authorization. You can try changing directories.
The Total and Subtotal API allows custom visuals with a matrix data-view to request aggregated subtotal data from the Power BI host. The subtotals are calculated for the entire matrix semantic model or specified for individual levels of the matrix data hierarchy. See the sample report for an example of the Total and Subtotal API in a Power BI visual.
Note
Requesting subtotal data is supported in version 2.6.0 and later. The rowSubtotalType property is available in version 5.1.0 and later. To find out which version you're using, check the apiVersion in the pbiviz.json file.
Every time a visual refreshes its data, the visual issues a data fetch request to the Power BI backend. These data requests are usually for values of the fields that the user dragged into the field wells of the visual. Sometimes the visual needs other aggregations or subtotals (for example, sum or count) applied to the field wells. The Total and Subtotal API lets you customize the outgoing data query to request more aggregation or subtotal data.
The subtotals API
The API offers the following customization for each data-view type (currently, only matrix data-views).
rowSubtotals: (boolean) Indicates if the subtotal data should be requested for all fields in the rows field well.rowSubtotalsPerLevel: (boolean) Indicates if the subtotal data can be toggled for individual fields in the row's field well.columnSubtotals: (boolean) Indicates if the subtotal data should be requested for all fields in the columns field well.columnSubtotalsPerLevel: (boolean) Indicates if the subtotal data can be toggled for individual fields in the columns field well.levelSubtotalEnabled: (boolean) Indicates if the subtotals are requested for the row or column. Unlike all the other properties, this property is applied to individual rows or columns.rowSubtotalsType: ("Top" or "Bottom") Indicates if the row with the total data should be retrieved before (top) or after (bottom) the rest of the data. If this property is set tobottom, the total can only be displayed after all the data is fetched. The default isbottom.
Each of these switches is assigned a value based on the related properties in the property pane and the defaults.
How to use the subtotal API
The visual's capabilities.json file has to:
- specify the property that each switch maps to.
- provide the default value to be used if the property is undefined.
The switches use a format like the following example:
    "rowSubtotals": {
                "propertyIdentifier": {
                    "objectName": "subTotals",
                    "propertyName": "rowSubtotals"
                },
                "defaultValue": true
            },
The preceding code indicates that the row subtotals are enabled by the property rowSubtotals in the subTotals object. The property has a default value of true.
The API is automatically enabled for a visual whenever the subtotals structure and all switch mappings are defined in the capabilities.json file.
The following code is an example of the complete API configuration in the capabilities.json file (copied from the API sample visual):
"subtotals": {
        "matrix": {
            "rowSubtotals": {
                "propertyIdentifier": {
                    "objectName": "subTotals",
                    "propertyName": "rowSubtotals"
                },
                "defaultValue": true
            },
            "rowSubtotalsPerLevel": {
                "propertyIdentifier": {
                    "objectName": "subTotals",
                    "propertyName": "perRowLevel"
                },
                "defaultValue": false
            },
            "columnSubtotals": {
                "propertyIdentifier": {
                    "objectName": "subTotals",
                    "propertyName": "columnSubtotals"
                },
                "defaultValue": true
            },
            "columnSubtotalsPerLevel": {
                "propertyIdentifier": {
                    "objectName": "subTotals",
                    "propertyName": "perColumnLevel"
                },
                "defaultValue": false
            },
            "levelSubtotalEnabled": {
                "propertyIdentifier": {
                    "objectName": "subTotals",
                    "propertyName": "levelSubtotalEnabled"
                },
                "defaultValue": true
            },
            "rowSubtotalsType": {
                "propertyIdentifier": {
                    "objectName": "subtotals",
                    "propertyName": "rowSubtotalsType"
                },
                "defaultValue": "Bottom"
            }
        }
    }
It's important that the enumerateProperties() function of the visual aligns with the defaults specified in the capabilities.json file. The customization logic operates according to the specified defaults. If the enumerateProperties() function and the defaults aren't aligned, the actual subtotal customizations might differ from user expectations.
enum RowSubtotalType {
        Top = "Top",
        Bottom = "Bottom",
   }
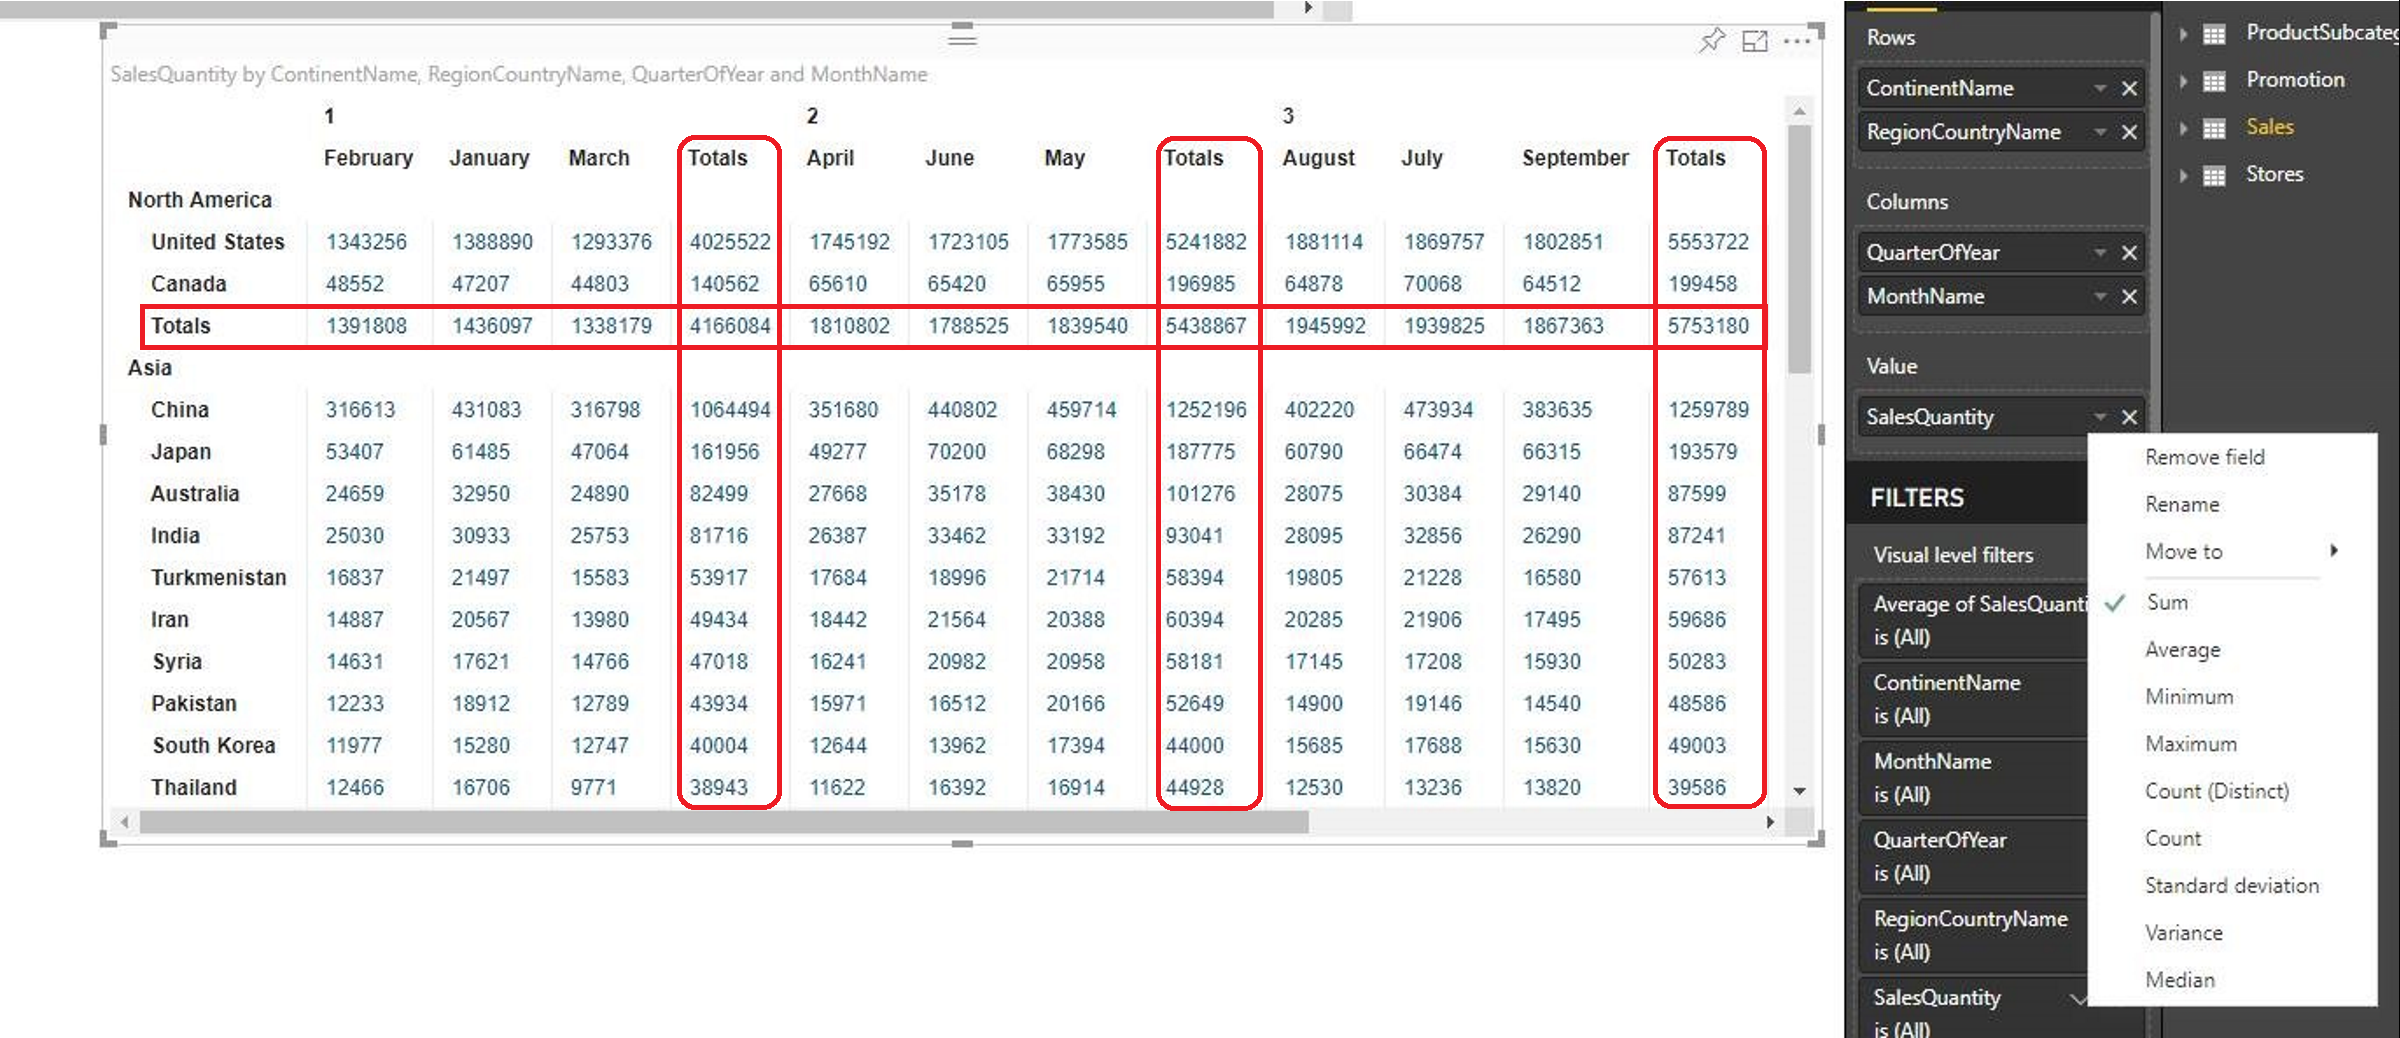
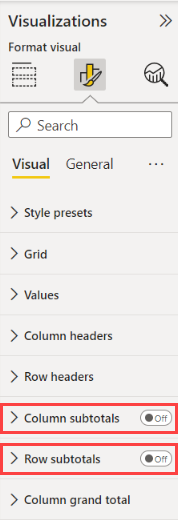
To review the available customizations, expand the Subtotals drop-down menu in the Format property pane. Modify the subtotals settings and track the changes to the subtotals presentation (named Totals) in the Visualizations pane.
Considerations and limitations
The
rowSubtotalsTypeproperty is only available for rows. You can't set column subtotals to the beginning of a column.The expand and collapse feature overrides
rowSubtotals. Subtotals display when the rows are expanded, even ifrowSubtotalsis set to false.
Related content
Add interactivity to visual using Power BI visuals selections