SQL Server Management Studio Provides–“XE Profiler”
Bob Ward and I worked with our SQL Server Tool developers (thanks David) to enable ‘Quick XE Trace’ capabilities. The feature is available in the latest SQL Server Management Studio (SSMS) release.
Despite the deprecation of SQL Profiler several years ago, as well as various documents and blogs pointing out the older trace facilities shortcomings and performance impact on the SQL Server, SQL Profiler is still a top choice of SQL Server Developers and DBAs. The ‘quick’ ability kept surfacing as a reason for using SQL Profiler. The ‘quick’ part was defined as getting live data on the DBA’s or Developer’s screen with just a few clicks.
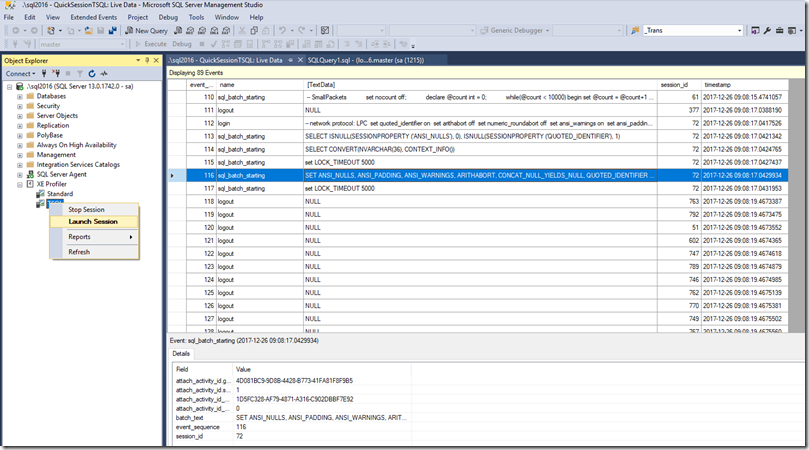
The new tree node (XE Profiler) provides that ‘quick’ ability. The ‘Quick XE Profiler’ displays live events using the simple ‘Launch Session’ menu selection. The templates capture common events and leverage XEvent enhanced view capabilities to display the event data.
Here is an example using the SQL Server SSMS 2017 against my SQL 2016 server.
Bob Dorr - Principal Software Engineer SQL Server
Comments
- Anonymous
January 16, 2018
Thanks Bob(s) this is great! Stay warm in Texas!
