Troubleshooting Windows AutoPilot (level 300/400)
In my last post, I talked about issues you might encounter with Windows AutoPilot. But what if you still can’t figure it out? Typically the support and development teams would want more information to see what’s going on. While I’m sure most IT pros would like to see log files or event logs that show the step-by-step flow, you’ll have to dig a little deeper in order to get something that can be used for a “post-mortem” analysis. What does that mean?
First, Windows AutoPilot uses Event Tracing for Windows (ETW) to capture events during the AutoPilot process. Those events need to be enabled and captured so that they can be inspected and interpreted. How do you do that? Here are the basic steps:
- On the first OOBE screen where you select a language, press Shift-F10 to open a command prompt.
- Insert a USB key containing the AutoPilot.wprp file (attached to this blog, extract it from the zip file) that defines the events to collect, or map a drive to a network share that contains the file.
- Start the trace using the Windows Performance Recorder (WPR) tool that is built into Windows. (I talked about that a few years ago in a different context, https://blogs.technet.microsoft.com/mniehaus/2012/09/13/using-the-windows-performance-toolkit/.) The command line to use:wpr.exe -start <folder location>\AutoPilot.wprp
- Exit from the command prompt.
- Finish your AutoPilot process, continuing at least as far as you need to go to reproduce the issue.
- Stop the recording using WPR.EXE, specifying where to put the resulting trace (press Shift-F10 to open another command prompt if you are still in OOBE): wpr.exe -stop C:\AutoPilot.etl
That part is easy enough. The next challenge is reading and interpreting that file. There are some options for doing that:
- Windows Performance Analyzer, provided as part of the ADK.
- Microsoft Network Analyzer (formerly called Network Monitor).
- TRACEFMT.EXE, a command-line utility that can convert the binary ETL file into XML or other formats.
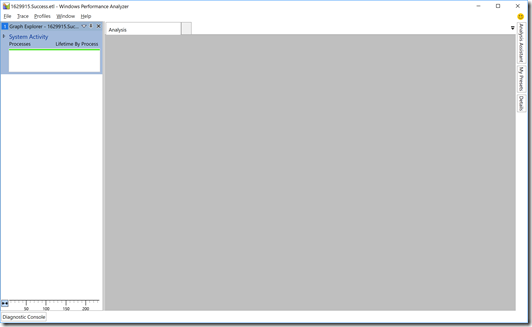
My personal preference is to use Windows Performance Analyzer (WPA). To get started with this process, let’s look at an ETL file captured from a 100% successful AutoPilot deployment, which I captured using the process described above. After opening the file in WPA, you will see this view:
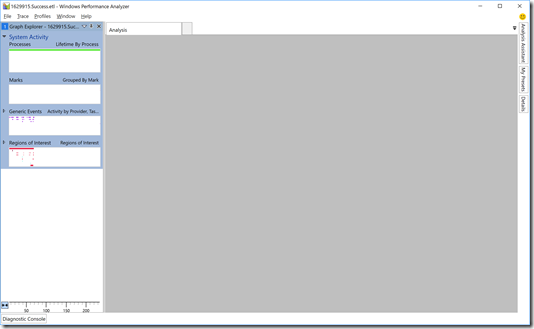
Exciting, right? Well, not until you dig in more. First, click the triangle before the “System Activity” label to get to this view:
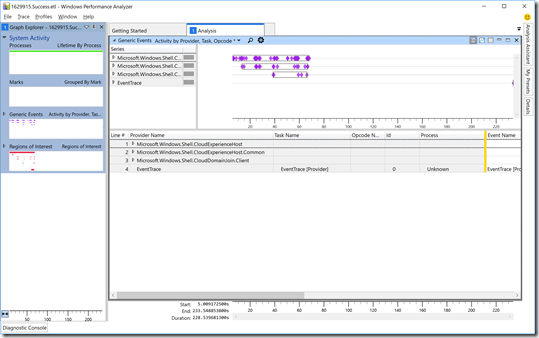
Then double-click on the “Generic Events” block to show the details:
Now we can at least see some data. Let’s focus in on two specific providers:
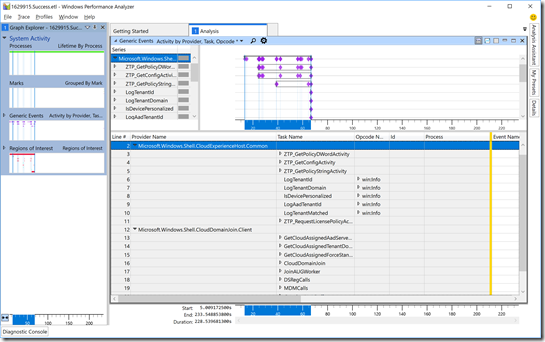
- Microsoft.Windows.Shell.CloudExperienceHost.Common. This is where you’ll find the AutoPilot-generated events. Some of these are prefixed with “ZTD” (related to the old codename for AutoPilot), while others aren’t prefixed.
- Microsoft.Windows.Shell.CloudDomainJoin.Client. Events that are part of the initial “is this an AutoPilot deployment,” the AAD join process, and MDM enrollment are from this provider.
So let’s expand those for two “normal” cases. First, for a device that is configured for AutoPilot:
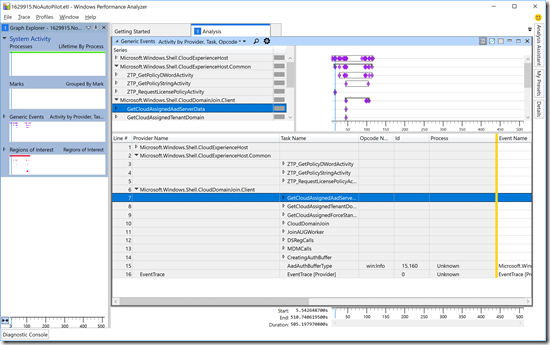
Compare that to a device that was not enrolled in AutoPilot, but was still joined to Azure AD and automatically enrolled in Intune:
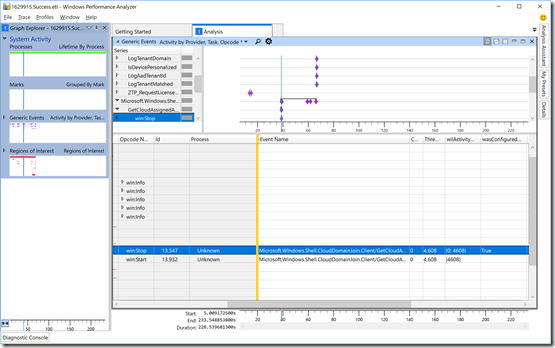
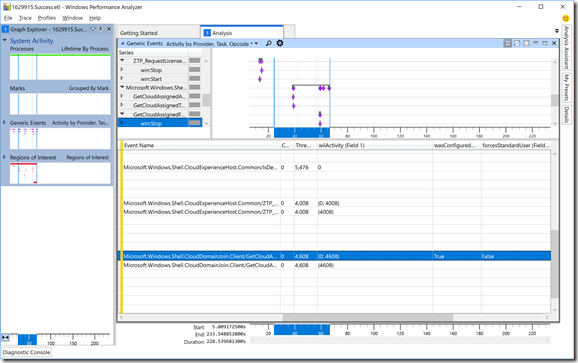
Not surprisingly, there are fewer events for the non-AutoPilot scenario. But let’s dig into those events a little more, first the “GetCloudAssignedAadServerData” event. Click on the triangle to the left of the “GetCloudAssignedAadServerData” task name, then select the “win:Stop” opcode (which shows the result). Scroll to the right to see the data for an AutoPilot-defined machine:
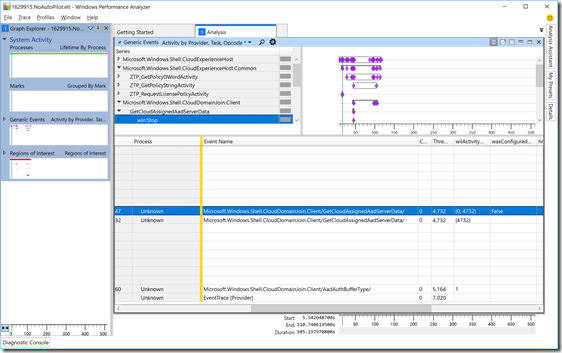
Notice the “wasConfigured” value is “True,” indicating that this device is indeed registered with AutoPilot. Compare that with a device that isn’t:
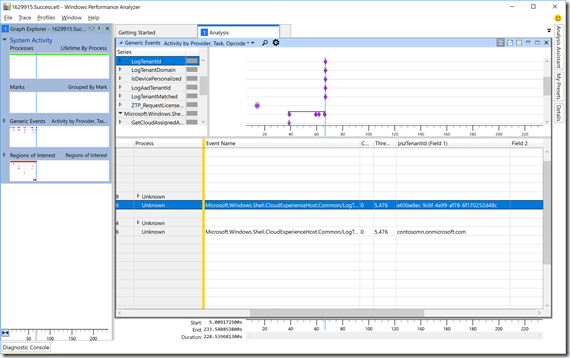
And not surprisingly, that shows “False” for the device that isn’t registered. OK, so back to the registered device. To see what Azure AD tenant it is registered with, we can check the “LogTenantId” and “LogTenantDomain” tasks. Expand the “win:Info” opcodes for each and again scroll to the right:
There, you can see the Azure AD tenant ID (a GUID, which you can also find in the Azure Portal in the Azure AD tenant’s properties) and the tenant name (in this case, “contosomn.onmicrosoft.com”). (Do you see the “IsDevicePersonalized” task name? That’s for a coming AutoPilot feature that enables a device to be assigned to a user to further customize the “welcome” experience. That’s not enabled yet, so it always returns “0” today.)
Let’s look at one more item, the “GetCloudAssignedForceStandardUser” task name (with the same routine: expand, select win:Stop, scroll right):
This shows that it’s configured (wasConfigured is “True”) to not force the Azure AD user to be a standard user (forceStandardUser is “False”).
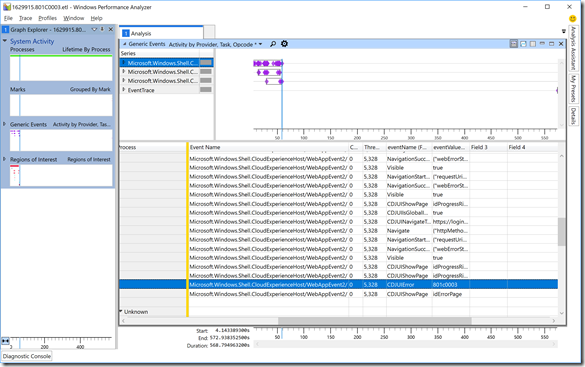
Now lets look at a different trace, this one showing a failure with Azure AD join, error 801C0003 (“Something went wrong”) covered in the previous troubleshooting blog. We’ll take a different approach this time, just searching for a specific “Event Name” value. Click on the magnifying glass at the top of the “Generic apps” (right-hand) pane to get a search box, and search for “CDJUIError”. That will take you directly to the row that has the error, showing you the 801C0003 error code (which you can then look up, see the link at the bottom of the previous blog):
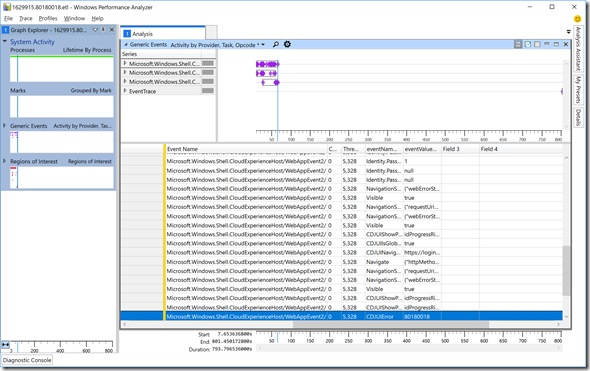
That same approach would work for any Azure AD join issue. But what about MDM enrollment issues? Let’s look at another error, the 80180018 error (“Something went wrong”) from the previous post indicating that the device could not be enrolled in MDM. Guess what? It shows up in the exact same “CDJUIError” field:
That leaves one key piece of information: What are the actual profile settings (e.g. skip privacy settings, skip EULA, etc.) that were configured for the device? Those are reported in a bitmap:
SkipCortanaOptIn = 1,
OobeUserNotLocalAdmin = 2,
SkipExpressSettings = 4,
SkipOemRegistration = 8,
SkipEula = 0x10
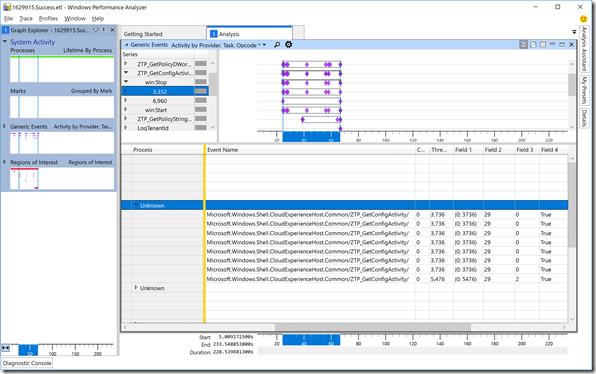
The first four were present in Windows 10 1703, while the last one was added in Windows 10 1709. In my case, I know that I enabled all options except the “OobeUserNotLocalAdmin” one (I wanted the user to have admin rights), so the value should be 1+4+8+16 = 29. If we look at the trace, we see that is shown in all the “ZTP_GetConfigActivity” tasks (again, expand the entries, expand the win:Stop opcodes, and then one more level with process “Unknown”):
Sure enough, each of those (which are checking individual settings given the complete bitmap value) shows the value 29 in the “Field 2” column. If you configured different options, the value would be different in that column.
I won’t claim that I’m particularly good with ETW or Windows Performance Analyzer, but hopefully this will give you some hints on what to look for in the traces. If you pick up any additional tidbits looking at these traces, let me know. Also, in case you were to open a support case for AutoPilot, don’t be surprised if they ask you to recreate the problem with a trace running, using the steps described at the top of this blog, sending the resulting ETL file so that they can walk through it and look at what happened.
Comments
- Anonymous
December 14, 2017
SkipCortanaOptIn = 1,OobeUserNotLocalAdmin = 2,SkipExpressSettings = 4,SkipOemRegistration = 8,SkipEula = 0x10The first four were present in Windows 10 1703, while the last one was added in Windows 10 1709. In my case, I know that I enabled all options except the “OobeUserNotLocalAdmin” one (I wanted the user to have admin rights), so the value should be 1+4+8+16 = 29Can any one explain what is 16 value ?- Anonymous
December 14, 2017
0x10 in decimal = 16 ?- Anonymous
December 14, 2017
Yes, the 0x prefix means the value is in hex. So hex 10 = decimal 16.- Anonymous
December 14, 2017
Thanks
- Anonymous
- Anonymous
- Anonymous
- Anonymous
December 26, 2017
Great info!
