SSISDB Reporting with Power BI
Back in 2012 when the project deployment model came out for SSIS, many questions were asked regarding its advantages vs the old legacy deployment model. I still see quite a few customers today who use the old legacy package deployment model. The upgrade/conversion process from package deployment to project is quite straight-forward, and I encourage any slow adopters to migrate their environment. One of the major benefits of the project deployment model is the SSISDB, which is a system created database which tracks many different metrics regarding the SSIS environment. Additionally, with the popularity of Power BI Desktop it becomes very easy to report and understand the Integration Services environment holistically without needing to spend large sprint cycles to implement.
With that in mind, I have built the below Power BI report that quickly reports on the performance of the packages located within the SSIS catalog. There are 2 pages on the dashboard. The first, Overall Executions, shows the overall number of executions that have been tracked within the catalog:
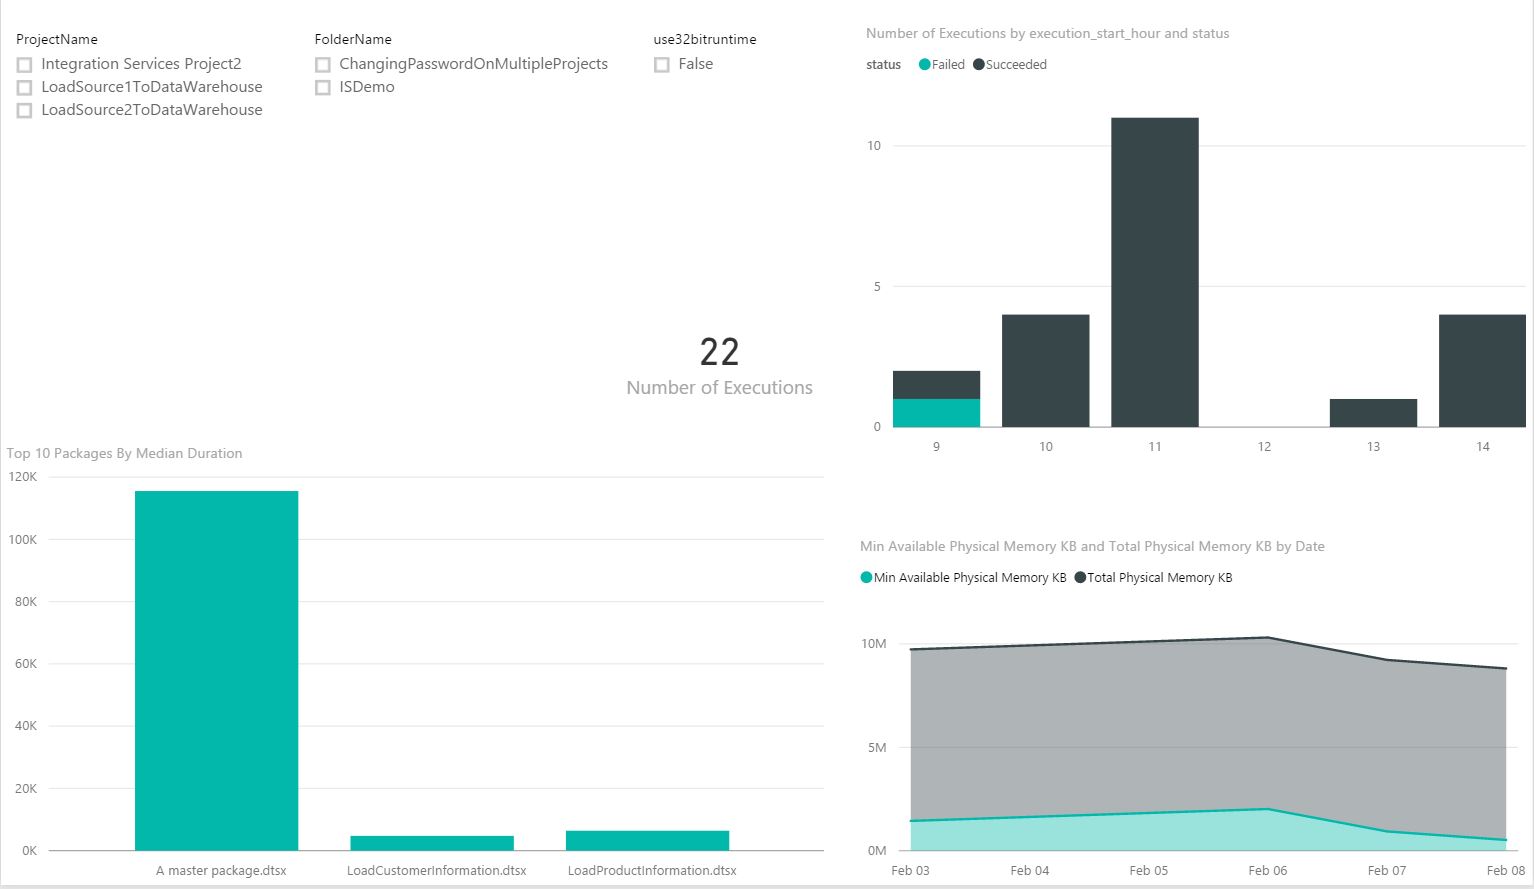
There are various slicers at the top to filter by project, folder, or whether or not the package was run in 32 bit mode. At the top right the dashboard will show the number of packages that have completed successfully or failed by time of day. In the bottom left the median duration of each package is reported. Finally in the bottom right the min available physical memory is reported against the total physical memory in KB. If the min available physical memory drops to 0 this would be a major performance degradation for SSIS.
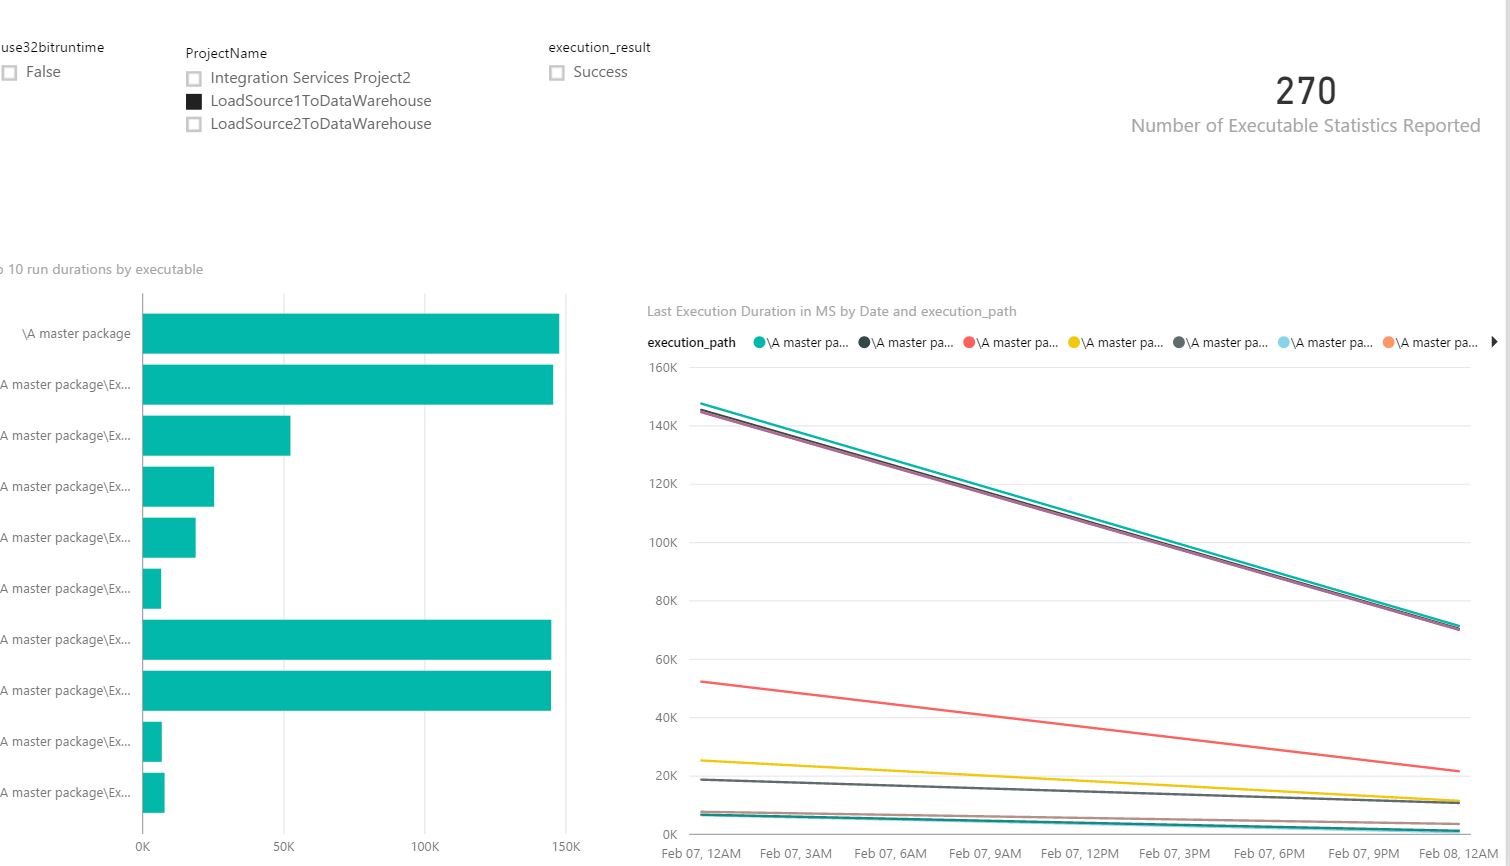
The second page is a more detailed drill down of the individual executables. Using the various slicers for project, 32 bit run time, and execution result, the user is able to get a glimpse of the 10 longest running executables as of their last runs, and in the bottom right see the trend of those executables over time. Below is a screenshot:
The template is available for download here. When you open the file you will be prompted to enter the server name where the SSISDB instance resides. If you need to modify the dates (the template is pre-populated from 1/1/2016-12/31/2017), you can edit the query by going to “Edit Queries” at the top of the page. Click on the date table, and then under the “Applied Steps” on the right hand side click on Source. Modify the date function from
= DateFunction(#date(2016, 1, 1), #date(2017, 12, 31), null)
To whatever you would like your dates to be.
With the combination of the project deployment model and the above Power BI report, every single individual who uses SSIS in some way should have a complete holistic picture of the performance of their environment anytime it is needed.
Comments
- Anonymous
April 18, 2017
Got an error when running it: Column 'PackageName' in Table 'Package' contains a duplicate value 'MyPackage.dtsx' and this is not allowed for columns on the one side of a many-to-one relationship or for columns that are used as the primary key of a table.Not sure what query generated that error.- Anonymous
April 20, 2017
Actually, it was a handful of issues. Package isn't unique based on just PackageName. I managed to combine Package + Folder + Project and join that to the Executions with some finagling, but then couldn't join Executions to the stats because I needed a 1:1 relationship. Even converting both IDs into a character field on both sides. I know that's unique, but was getting told it wasn't.May be worth testing this out with a more complex setup where some projects use packages having the same name. I don't think that's that uncommon out in the real world. :)I appreciate the idea, though. I'll pick it up again when I have a little more time to see if I can get it to work with our data.- Anonymous
April 21, 2017
Peter, You are absolutely right. I'd initially loaded it to TechNet and then on some further troubleshooting had found some things I'd wanted to clean up on it to prevent that from happening. I've loaded the more recent version up to TechNet again, please let me know if you have any issues with it. I also feel that this would be better to be hosted on GitHub, not TechNet so it can be more collaboratively worked on. Here is the GitHub repo:https://github.com/chrschmi/PBI_SSISI'll update the link in the post above as well.
- Anonymous
- Anonymous
- Anonymous
August 15, 2017
This is Legit, Thanks! - Anonymous
September 08, 2017
Thanks Chris for this Dashboard.I used it as a starting point along with a series of other ssis queries I use on a regular basis for an full dashboard I now use daily for performance monitoring and error triage.I've posted it on the Power BI Data Stories Galleryhttp://community.powerbi.com/t5/Data-Stories-Gallery/SSIS-Catalog-DB-Dashboard/m-p/244677Phil- Anonymous
September 11, 2017
Phil, That is really cool - I love the way you expanded on the content and were able to create a fully comprehensive view of the environment. Very neat dashboard!Chris
- Anonymous