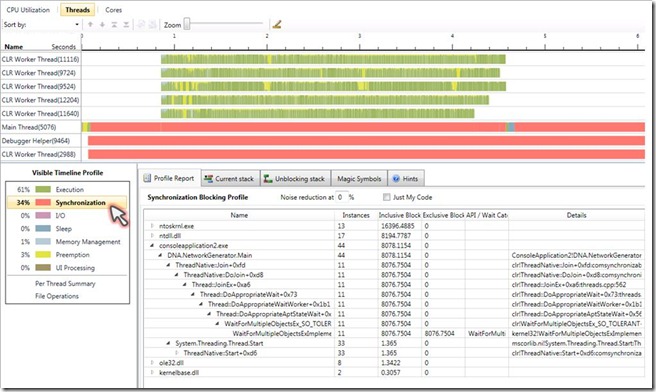
Profiles of Waiting Time
We noticed that some customers did not find a pretty unique feature of the Concurrency Visualizer: if you click on any of the non-green “colors” in the “Visible Timeline Profile” legend, you can get a profile of the waiting time of the selected category (e.g. if you click red, you’ll see how much time was spent in different routines waiting for synchronization).
This report is quite similar to the sample execution profile that you get by clicking on green in the legend, with the difference that it is waiting (and not executing) time. It is calculated from exact instrumentation data and not from sampling.
Using this feature can quickly lead you to the places where you wait the most.
