Observação
O acesso a essa página exige autorização. Você pode tentar entrar ou alterar diretórios.
O acesso a essa página exige autorização. Você pode tentar alterar os diretórios.
Estes exemplos mostram interações comuns com tabelas do Excel.
Observação
Execute estes exemplos diretamente a partir do Editor de Código de Scripts do Office. Para abrir o Editor de Código, aceda a Automatizar>a Criação de Novo Script>no Editor de Código. Substitua o código predefinido pelo código de exemplo que pretende executar e, em seguida, selecione Executar.
Criar uma tabela ordenada
Este exemplo cria uma tabela a partir do intervalo utilizado da folha de cálculo atual e ordena-a com base na primeira coluna.
function main(workbook: ExcelScript.Workbook) {
  // Get the current worksheet.
  const selectedSheet = workbook.getActiveWorksheet();

  // Create a table with the used cells.
  const usedRange = selectedSheet.getUsedRange();
  const newTable = selectedSheet.addTable(usedRange, true);

  // Sort the table using the first column.
  newTable.getSort().apply([{ key: 0, ascending: true }]);
}
Filtrar uma tabela
Este exemplo filtra uma tabela existente com os valores numa das colunas.
function main(workbook: ExcelScript.Workbook) {
  // Get the table in the workbook named "StationTable".
  const table = workbook.getTable("StationTable");

  // Get the "Station" table column for the filter.
  const stationColumn = table.getColumnByName("Station");

  // Apply a filter to the table that will only show rows
  // with a value of "Station-1" in the "Station" column.
  stationColumn.getFilter().applyValuesFilter(["Station-1"]);
}
Filtrar um valor
O exemplo anterior filtra uma tabela com base numa lista de valores incluídos. Para excluir um valor específico da tabela, tem de fornecer a lista de todos os outros valores na coluna. Este exemplo utiliza uma função columnToSet para converter uma coluna num conjunto de valores exclusivos. Esse conjunto tem, em seguida, o valor excluído ("Estação-1") removido.
function main(workbook: ExcelScript.Workbook) {
  // Get the table in the workbook named "StationTable".
  const table = workbook.getTable("StationTable");

  // Get the "Station" table column for the filter.
  const stationColumn = table.getColumnByName("Station");

  // Get a list of unique values in the station column.
  const stationSet = columnToSet(stationColumn);

  // Apply a filter to the table that will only show rows
  // that don't have a value of "Station-1" in the "Station" column.
  stationColumn.getFilter().applyValuesFilter(stationSet.filter((value) => {
      return value !== "Station-1";
  }));
}

/**
 * Convert a column into a set so it only contains unique values.
 */
function columnToSet(column: ExcelScript.TableColumn): string[] {
    const range = column.getRangeBetweenHeaderAndTotal().getValues() as string[][];
    const columnSet: string[] = [];
    range.forEach((value) => {
        if (!columnSet.includes(value[0])) {
            columnSet.push(value[0]);
        }
    });

    return columnSet;
}
Copiar conteúdos filtrados para uma nova folha de cálculo
Este exemplo filtra os dados numa tabela e, em seguida, copia os dados filtrados para uma nova folha de cálculo.
SpecialCellType Utiliza para obter as células filtradas na tabela original e, em seguida, utiliza Range.copyFrom para copiar os dados para a nova folha de cálculo.
function main(workbook: ExcelScript.Workbook) {
    // Get the table in the workbook named "StationTable".
    const table = workbook.getTable("StationTable");

    // Get the "Station" table column for the filter.
    const stationColumn = table.getColumnByName("Station");

    // Apply a filter to the table that will only show rows
    // with a value of "Station-1" in the "Station" column.
    stationColumn.getFilter().applyValuesFilter(["Station-1"]);

    // Get the filtered table data, as visible cells.
    const filteredTable = worksheet.getUsedRange();
    const visibleRange = filteredTable.getSpecialCells(ExcelScript.SpecialCellType.visible);

    // Create a new worksheet for the filtered data.
    const newWorksheet = workbook.addWorksheet();

    // Loop through the filtered data and copy to new worksheet.
    visibleRange.getAreas().forEach(areaRange => {
      newWorksheet.getRange("A1").copyFrom(areaRange);
    })
}
Remover filtros de coluna de tabela
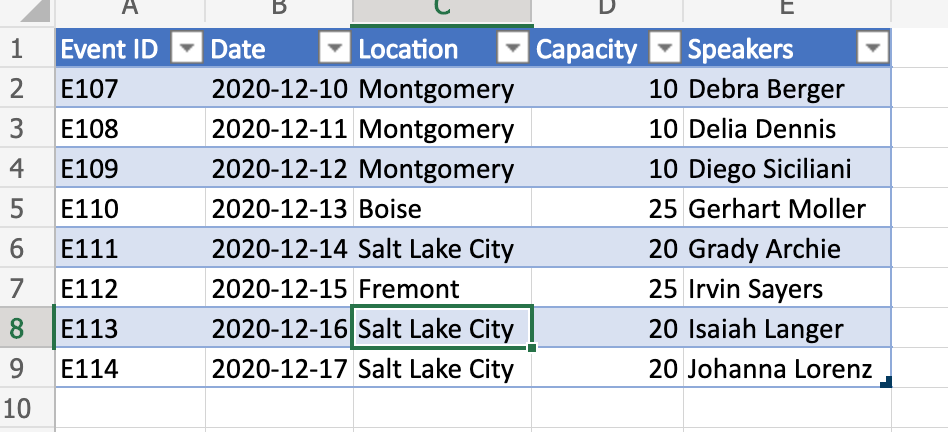
Este exemplo remove os filtros de uma coluna de tabela, com base na localização da célula ativa. O script deteta se a célula faz parte de uma tabela, determina a coluna da tabela e limpa os filtros que são aplicados à mesma.
Transfira table-with-filter.xlsx para um livro pronto a utilizar. Adicione o seguinte script para experimentar o exemplo!
function main(workbook: ExcelScript.Workbook) {
  // Get the active cell.
  const cell = workbook.getActiveCell();

  // Get the tables associated with that cell.
  // Since tables can't overlap, this will be one table at most.
  const currentTable = cell.getTables()[0];

  // If there's no table on the selection, end the script.
  if (!currentTable) {
    console.log("The selection is not in a table.");
    return;
  }

  // Get the table header above the current cell by referencing its column.
  const entireColumn = cell.getEntireColumn();
  const intersect = entireColumn.getIntersection(currentTable.getRange());
  const headerCellValue = intersect.getCell(0, 0).getValue() as string;

  // Get the TableColumn object matching that header.
  const tableColumn = currentTable.getColumnByName(headerCellValue);

  // Clear the filters on that table column.
  tableColumn.getFilter().clear();
}
Antes de limpar o filtro de coluna (repare na célula ativa)
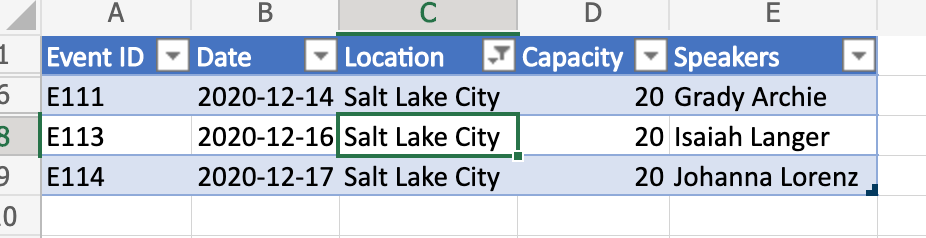
Depois de limpar o filtro de coluna
Dica
Se quiser saber mais sobre como guardar o filtro antes de o limpar (e voltar a aplicar mais tarde), consulte Mover linhas entre tabelas ao guardar filtros, uma amostra mais avançada.
Referenciar dinamicamente valores de tabela
Este script utiliza a sintaxe "@COLUMN_NAME" para definir fórmulas numa coluna de tabela. Os nomes das colunas na tabela podem ser alterados sem alterar este script.
function main(workbook: ExcelScript.Workbook) {
  // Get the current worksheet.
  const table = workbook.getTable("Profits");

  // Get the column names for columns 2 and 3.
  // Note that these are 1-based indices.
  const nameOfColumn2 = table.getColumn(2).getName();
  const nameOfColumn3 = table.getColumn(3).getName();

  // Set the formula of the fourth column to be the product of the values found
  // in that row's second and third columns.
  const combinedColumn = table.getColumn(4).getRangeBetweenHeaderAndTotal();
  combinedColumn.setFormula(`=[@[${nameOfColumn2}]]*[@[${nameOfColumn3}]]`);
}
Antes do script
| Mês | Price | Unidades Vendidas | Total |
|---|---|---|---|
| Jan | 45 | 5 | |
| Fev | 45 | 3 | |
| Mar | 45 | 6 |
Depois do script
| Mês | Price | Unidades Vendidas | Total |
|---|---|---|---|
| Jan | 45 | 5 | 225 |
| Fev | 45 | 3 | 135 |
| Mar | 45 | 6 | 270 |
Confira também
Colaborar conosco no GitHub
A fonte deste conteúdo pode ser encontrada no GitHub, onde você também pode criar e revisar problemas e solicitações de pull. Para obter mais informações, confira o nosso guia para colaboradores.