Peer analysis in Advanced insights
Important
This article is for the legacy Workplace Analytics app and does not reflect functionality available on the updated Viva Insights platform. Access current documentation for Viva Insights advanced insights here: advanced insights documentation.
Peer analyses help you find answers to the question: How do the most effective people—the best performing people in a company—collaborate differently than their peers? (Note: In this article, we’ll refer to these people as the reference group, and the people we compare them with—their peers—as the other group.)
The immediate goal of this kind of analysis is to help you discover the unique workplace-collaboration traits that help these people succeed. The larger goal is to use these insights to spread these behaviors so that the peers of the reference group, and others in the company, can benefit from them.
You work towards the first goal through a peer analysis. This procedure consists of the following tasks:
- Start an analysis.
- Identify the reference group. You do this either by using filters or by uploading a .csv file that contains the email addresses of the members of the group.
- Select the other group. After you've identified the reference group, you next identify the other group for comparison. This, too, you can do either with filters or by uploading a .csv file.
- (Optional) Apply conditions. In this step, you help assure that your comparison makes sense for the groups that you’ve selected.
- Submit the analysis.
- View results. View the results of your analysis.
Roles
To be able to perform the tasks in this article, you must have either the analyst or the limited analyst role in the advanced insights app.
Privacy notes
Peer analyses enforce the minimum group size settings for your organization. In other words, if the number of members on a team that you select is smaller than the minimum group size, the analysis is halted and cannot continue. This applies to both the reference group and the other group.
The results of analyses are always presented in aggregate form. No individual's data is ever presented in isolation.
Start an analysis
Open Peer analysis. (If that link doesn't work, try this link instead.) If prompted, enter your work credentials.
Peer analysis shows a table of analysis that's been started or completed.
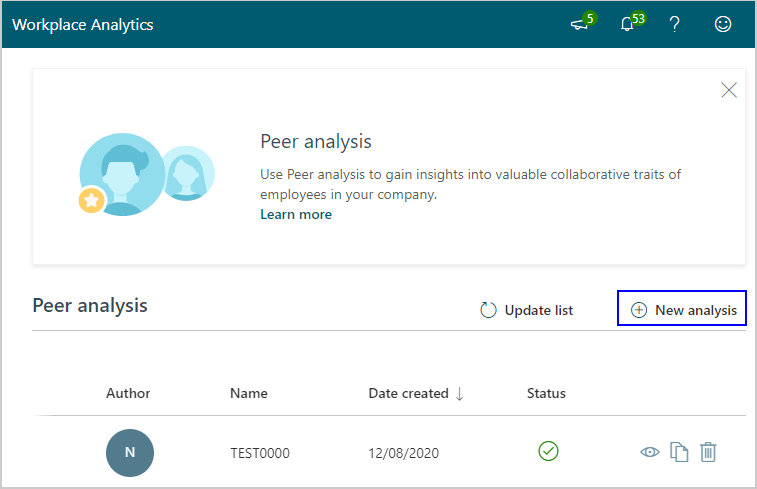
Select New analysis to initiate a new analysis. This opens a panel for creating the new analysis:
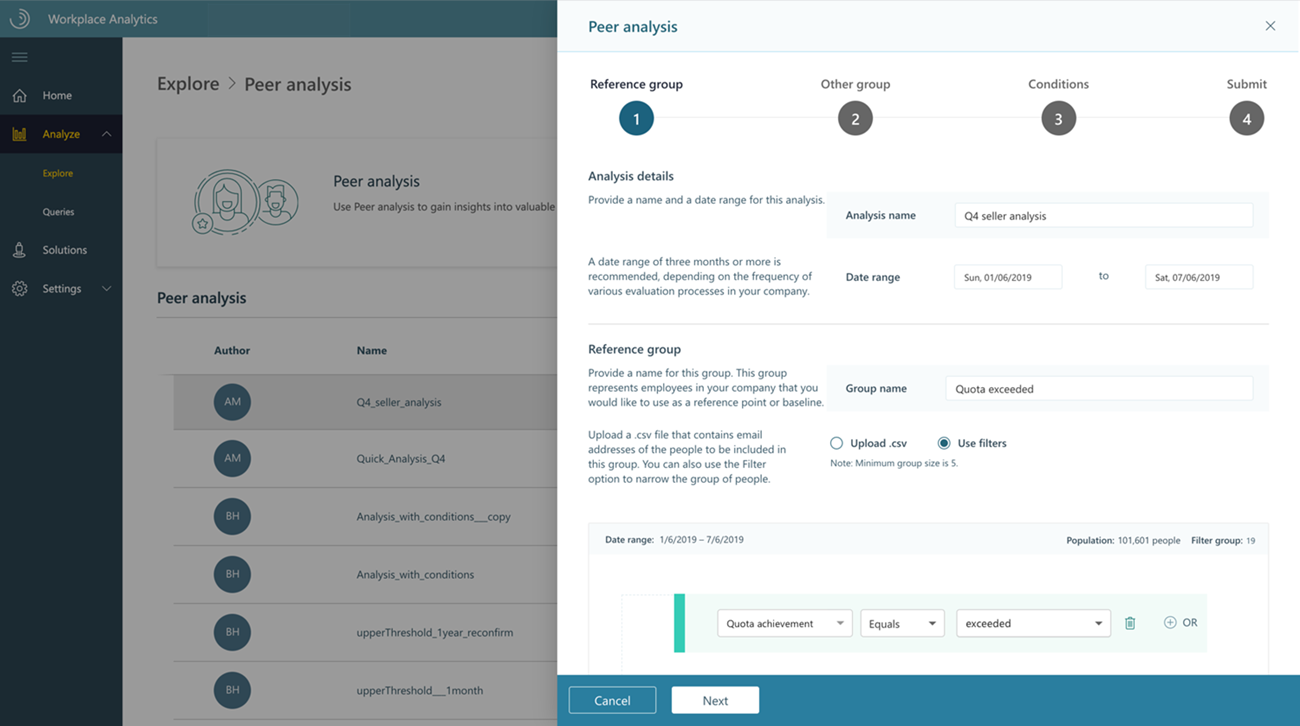
The top of this pane shows the four steps for creating a peer analysis: Reference group, Other group, Conditions, and Submit.
For Analysis name, type a name for this analysis.
Select a date range for the analysis.
Go to Identify the reference group.
Identify the reference group
Tip
Before you complete this task, you should know the group of people within your organization that you want to use for the reference group.
As you define this group, keep in mind that it has a maximum size. If you upload a .csv file, the group can contain no more than 150 members. If you use filters, the group can contain no more than 1000 members.
In the Reference group section, identify the members of this group. This is a group of your choosing; its members need not work together on the same team. You can identify them in either of the following ways:
- Upload a .csv file. For this, you’ll use a file that contains the email addresses of the people in the reference group.
- Use filters. To do this, you filter by HR (organizational) attributes.
Note
For more information about which way to identify this group, see Why use filters?
After you've successfully identified the reference group, select Next and go to Select the other group.
Select the other group
As you define this group, bear in mind that it has a maximum size. If you upload a .csv file, the group can contain no more than 150 members. If you use filters, the group can contain no more than 1000 members.
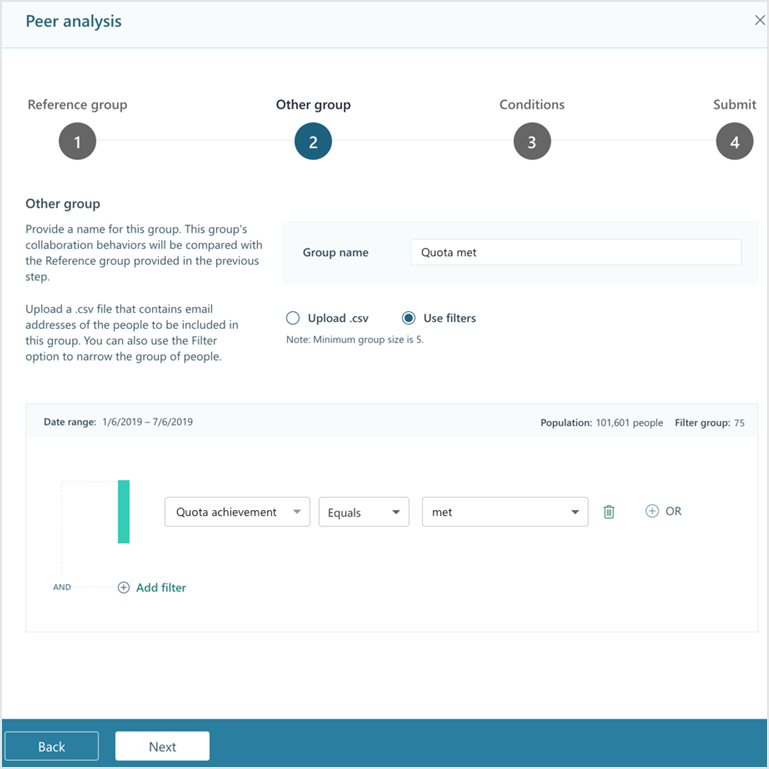
In the Other group section, identify the members of the other group. As with the reference group, you choose the other group; its members need not work together on the same team. You can identify them in either of the following two ways:
- Upload a .csv file. For this, you'll use a file that contains the email addresses of the people in the other group.
- Use filters. To do this, you filter by HR (organizational) attributes.
Note
For more information about which way to identify this group, see Why use filters?
After you've successfully identified the other group, select Next and go to Apply conditions.
Apply conditions
In this optional step, you make sure that the right people in each of your selected groups are being compared.
After you select Next in the Other group section, the Conditions page opens:
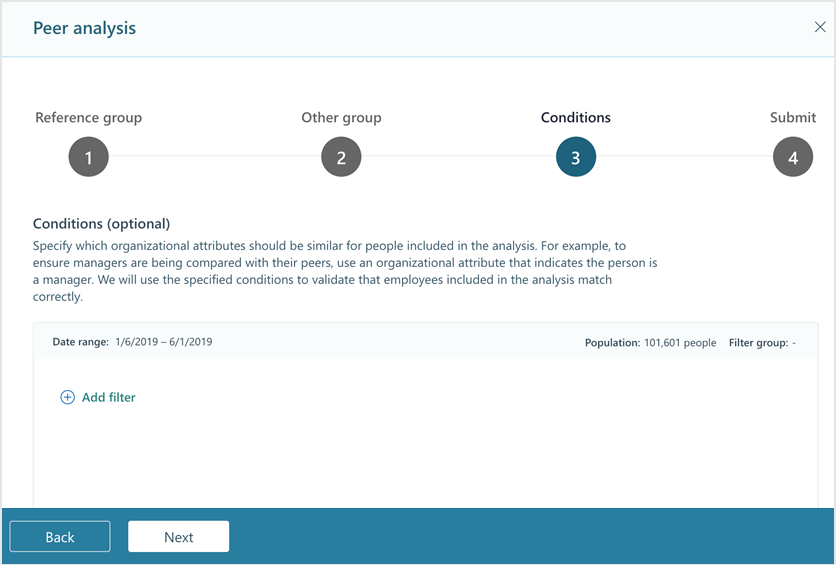
On this page, you filter by organizational (HR) data. These filters automatically apply to each of the groups that you've defined in the preceding steps, namely the reference group and the other group. By applying filters in this step, you refine your selections of employees in those groups so that the analysis can make more appropriate comparisons. For more information, see Why apply conditions?.
Note
You can skip this step by selecting Next.
After you have finished applying conditions, select Next and go to Submit the analysis.
Submit the analysis
The fourth and final screen of the sequence summarizes the choices that you've made by showing the analysis name, the date range, and the names and sizes of the reference and other groups. If you want to return to preceding steps to change any of these things, select Back:
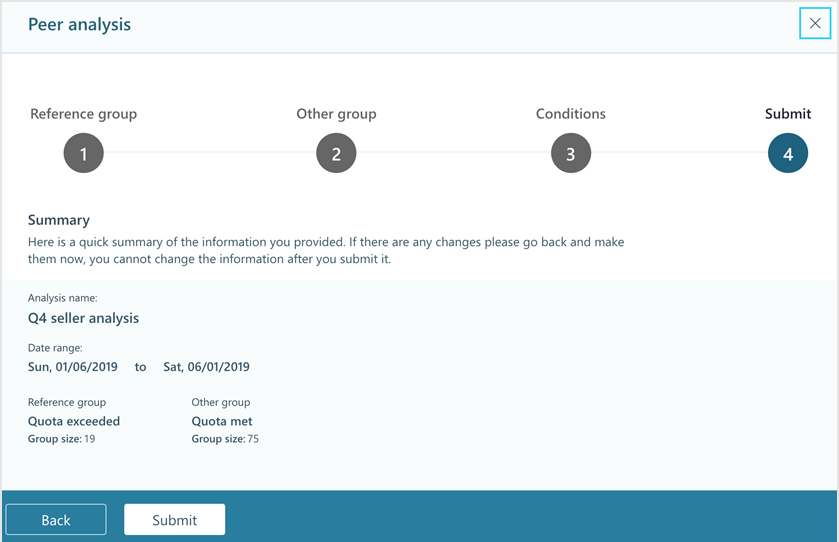
If you do not need to make changes, select Submit.
This opens the page that displays the Peer analysis table. The analysis that you just submitted appears at the top of the list with a status of running, as shown here:

Depending on the size of the analysis, the run time should take between several minutes and one hour. Go on to View results.
View results
After your analysis completes, its status is updated in the Peer analysis table with a check mark. In the following illustration, the second and third analyses have completed:
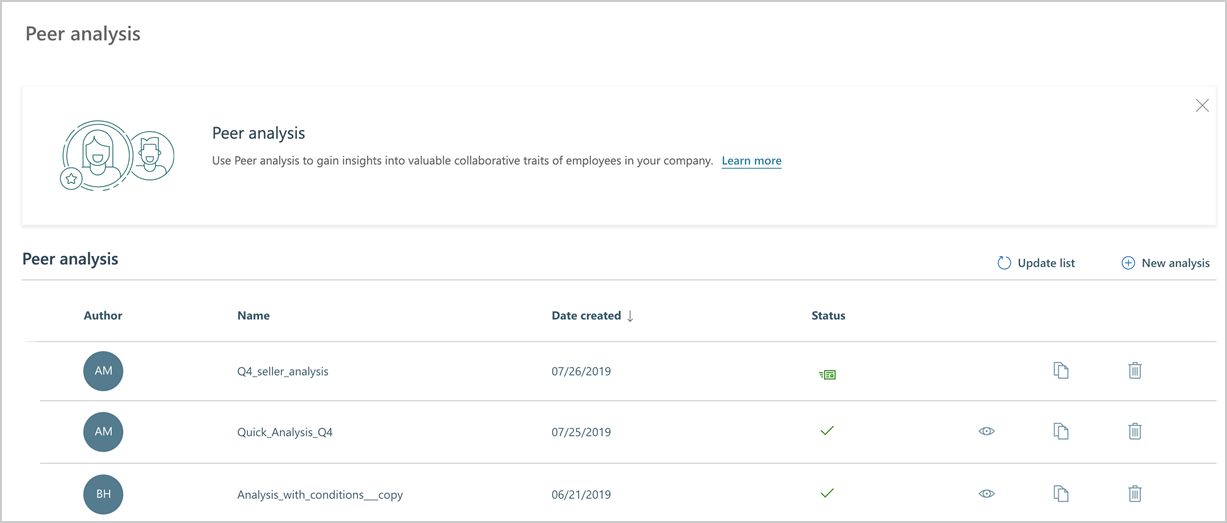
You can do the following on this page.
- In the rows of analyses:
- Select View (eye) icon to open the results for an analysis.
- Select Delete (trashcan) icon to delete an analysis that you no longer need.
- Select the Duplicate (two-sheets-of-paper) icon to make an editable copy of the analysis.
- Above the table:
- Select New analysis to create a new peer analysis.
- Select Update list to refresh the list of analyses.
Selecting View opens the Result page:
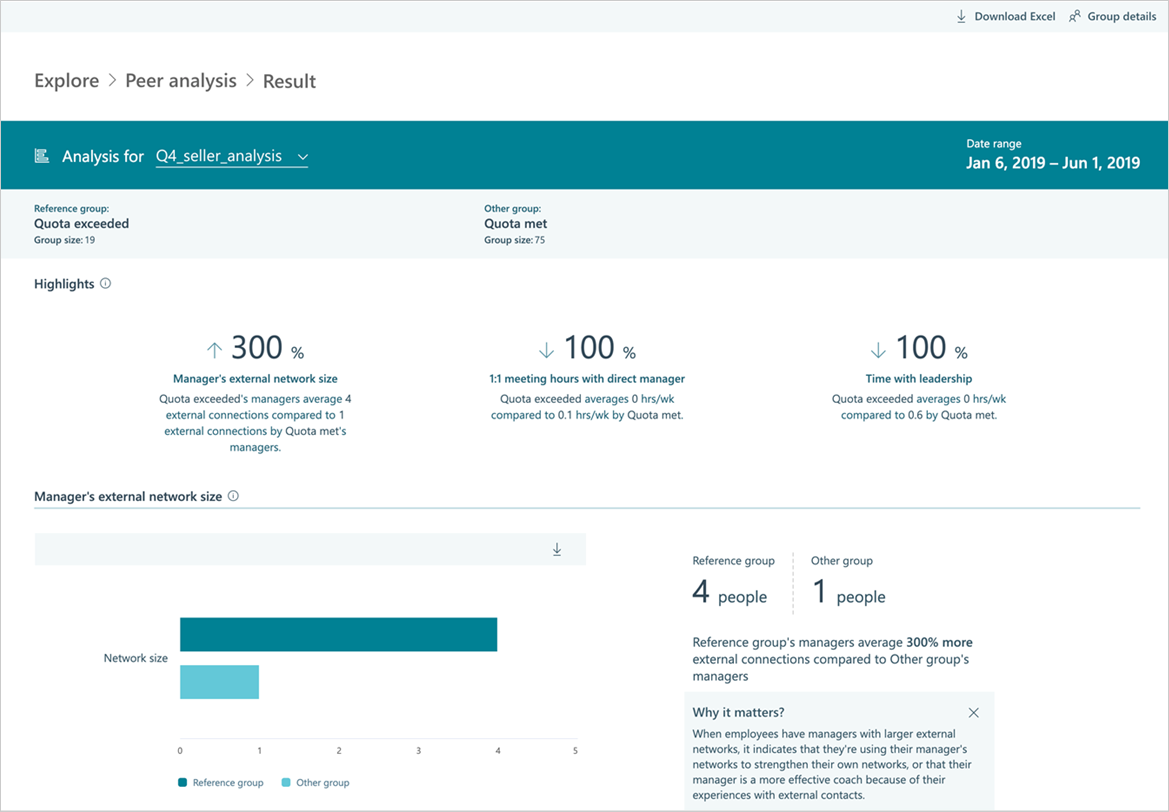
This page includes analysis details, such as: the analysis name, date range, name and size of the reference group, and the name and size of the other group.
The Highlights area displays the results of your analysis. The upper area presents summaries of the top three variant metrics for the groups. (Viva Insights selects these three metrics from among highly correlated metrics that are unique to this type of analysis.) The results that you see are comparisons of raw averages between the reference group and the other group.
In this example, they are Time with leadership, External network size, and Percentage of meeting hours with direct manager coattending.
Below these metrics summaries, the results for each metric are described in detail. Each detail section contains a description called Why it matters. This section explains why this metric analysis result is useful. Each section also contains an information icon — ⓘ — that you can select to learn more about the metric.
Although the Result page is read-only, you can download it into an Excel workbook file that you can open in Microsoft Excel or share with others.
Task details
Upload a .csv file
Follow these steps to upload a file that contains email addresses:
Create a .csv file that contains the email addresses of the people in the group. This file should contain no header, but consist of a single column, with each email address appearing on a new line.
Select Upload .csv file:

Browse to the file on disk and select Open. After the file uploads, Viva Insights automatically validates the uploaded data and displays the results:
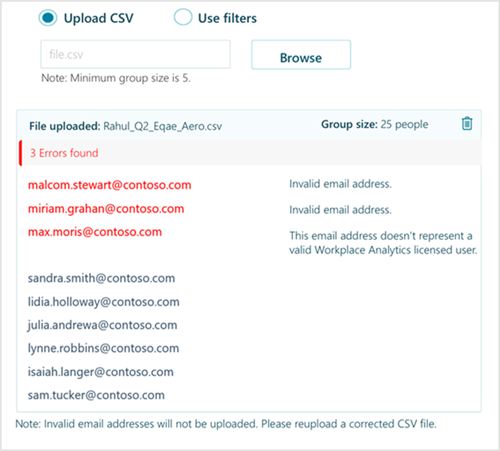
In this example, the validation results contain the errors of invalid email addresses and a person who has no Viva Insights license. You can choose to fix these errors by correcting or deleting the invalid email addresses, or having an admin assign the missing license. To participate, a person needs only a Viva Insights license assigned.
If validation errors are found, you cannot proceed with the analysis. After you correct the validation errors (or select a group with other participants), you must re-upload the .csv file to cause Viva Insights to validate the file again. After your .csv file successfully validates, you can proceed with the analysis.
Note
In addition to the minimum group size, a maximum group size is also in effect. The current maximum group size for peer analyses is 150 if you are uploading a .csv file to define the group, while the limit is 1000 members if you are using filters to define the group.
Return to your current step, either Identify the reference group or Select the other group.
Use filters
To identify a group by filtering, select Use filters:
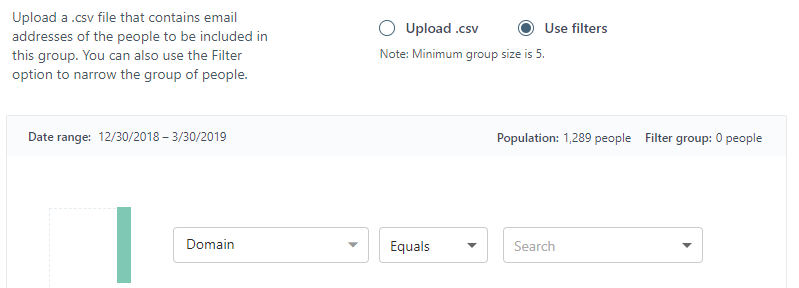
Add filters and parameters.
In this step, you use organizational data in filters to refine your group selection. For example, in the left box, select Organization and in the right box, type an org name or a manager's identifier. Add more filters to refine the selection further, if you want. The results of filtering are shown in a chart. You can then select groups by clicking the columns that represent them in the chart. You can select multiple groups.
For more information about what happens with selected groups when you make other settings on this page, see Persistence of group selections.
Now, you could proceed with the analysis if the group size falls between the allowed minimum and maximum group sizes. In this example, the actual group size (25) exceeds the minimum group size (five is the default, but it might be set to a higher number for your organization).
Note
In addition to the minimum group size, a maximum group size is also in effect. The current maximum group size for peer analyses is 150 if you are uploading a .csv file to define the group, while the limit is 1000 members if you are using filters to define the group.
Return to your current step, either Identify the reference group or Select the other group.
Concepts
Why use filters?
A typical use case for using filters would be if your organization uses outcome metrics such as sales quotas or performance or engagement ratings. If your admin has uploaded this data, you can use corresponding filters in this type of analysis. For example, while defining your reference group, you could filter to include employees who have achieved a particular sales quota or above. Then, one of your filters for the other group could specify sales quota below the level that you chose for the reference group.
Of course, if performance metrics cannot be or have not been uploaded for your organization, you cannot filter by them to select a group. In this case, remember that you can designate a group by uploading its members in a .csv file that contains email addresses.
Why apply conditions?
When you compare two groups of people, the purpose is to arrive at a meaningful comparison. For example, depending on your organization, it might not make sense to compare IT admins with software engineers. Their roles are different and so are the ways they are rated in performance evaluations and the expectations of how they interact with customers.
Because of differences such as these, making a direct, unrefined comparison of groups of employees might produce results that are not informative. For this reason, Viva Insights provides a way to improve the relevance and value of your comparisons: Add filters on the Conditions page:

Let's say you are looking at employees in the software engineering discipline. You might want to make sure that both the reference group and the other group consist entirely of software engineers. On this page, add a filter to define a condition such as: Discipline Equals Software engineer.
Viva Insights will then make sure that every user in both of the groups that you selected in the preceding steps (the example group and the peer group) match this condition. If they do not, it displays an error message:
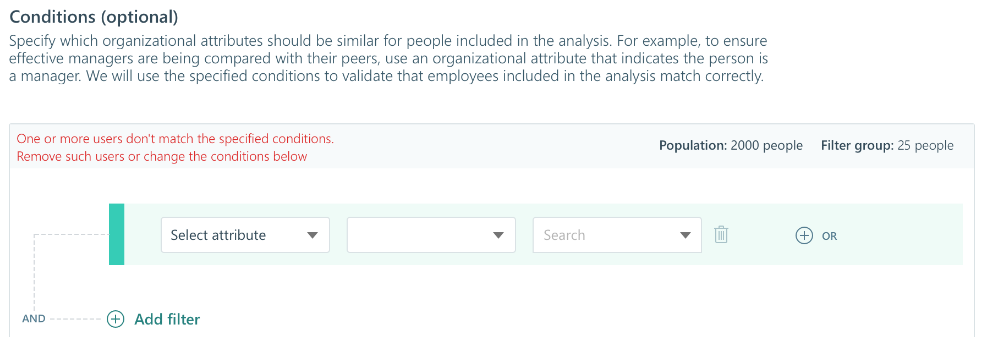
For privacy reasons, Viva Insights cannot inform you which user or users do not match the conditions. At this point, you'll need to select Back to return to the preceding steps and check the content of your groups, and make the necessary changes to eliminate this error.