Azure Service Fabric Application Insights working sample
This simple post is going to walk through the very basics of getting trace events to appear in Application Insights from Azure Service Fabric using EventFlow. First, let's discuss the options and the advantages and disadvantages of each. A sample application can be found here: - https://github.com/ross-p-smith/service-fabric-hot-telemetry
- Configure each service in the Service Fabric Application to directly push logs to Application Insights
- Use EventFlow to listen for events as they occur and push these events to Application Insights
- Configure Windows Azure Diagnostics on each node in the cluster to relay all events to Application Insights.
Scenario 1 : Direct Application Insights
[caption id="attachment_366" align="alignleft" width="300"] Configure Application Insights[/caption]
This method is by far the easiest to setup. From Visual Studio, simply right click the service you would like insights from and Configure Application Insights. This will take you to a wizard that will create Application Insights in the cloud or connect to an existing one.
Advantages: - Easiest way to get telemetry and if you are already using Application Insights, this is a no brainer.
Disadvantages: - This tightly couples your service to the output of the telemetry. What happens if you also want to send the events somewhere else.
Scenario 2: Using EventFlow
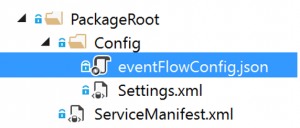
EventFlow provides a pluggable library so that Inputs and Outputs of telemetry information can be configured in a json file. This is a really nice solution as it does not tie you into a particular source or destination and allows multiple destinations to be configured based on severity or keywords. If you are using a .Net Core project, the json file unfortunately does not get created correctly when you add the EventFlow Nuget packages to your project, so I had to manually create this in the PackageRoot\Config location, which is very simple to do and is detailed at the GitHub page above.
After you add this file, make sure that you edit the properties of the file so that MSBuild does not make it a content file.
 Here is a list of the Nuget packages I used to get this sample working; you can see that there are some mandatory libraries and then input/output libraries depending on your scenario. It is important to note that you must ensure that you add the right package if you include an input or output in your eventFlowConfig.json as if you don't you don't get a useful error message to tell you what you have missed.
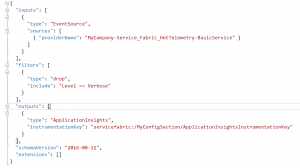
[caption id="attachment_395" align="alignleft" width="300"] EventFlowConfig.json[/caption]
Once you have EventFlow added to your project, you just need to configure it; in this sample it is nice and simple. You will notice that I only placed one provider name as an input which should match the attribute that is defined in your ServiceEventSource.cs or ActorEventSource.cs. These classes are created when you create a new service using the template from within Visual Studio. You will notice that I did not include the standard "Microsoft-ServiceFabric-Services" provider name here, we will come back to this later.
It is normal that you will want to direct telemetry to different instances of ApplicationInsights for your dev / test and production, so we also need a mechanism to pass in this instrumentation key based on a deployment scenario. As you can see in the 'Output'above, I have created a setting that will hold that key, this is a special EventFlow syntax that relates to the Settings.xml in the PackageRoot\Config.
[caption id="attachment_405" align="alignright" width="300"] settings.xml[/caption]
You can see that I have left the 'Value' blank deliberately so that no hard coded value is checked in to source control. This will mean that we can update config separately from code now.
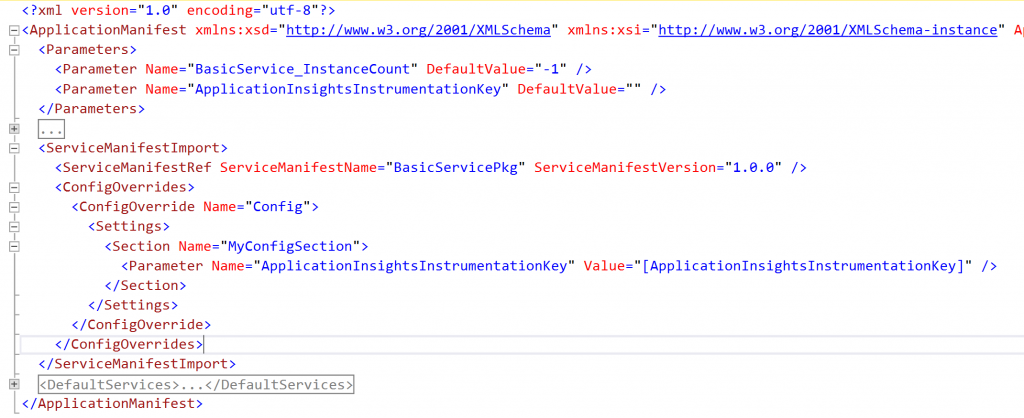
In order to populate the ApplicationInsightsInstrumentationKey value I need to tell the Service Fabric Application that this will come in from ApplicationParameters at deploy time. This is achieved by defining a ConfigOverride in the ApplicationManifest.xml. We need a Parameter defined at the top and then use the [] syntax to represent a variable.
[caption id="attachment_406" align="alignnone" width="1024"] ApplicationManifest.xml[/caption]
You then need to put your real instrumentation key in the Local.1Node, Local.5node or cloud.xml files in the ApplicationParameters folder within the Service Fabric application project. You are all good to go!
Advantages: Takes the decision of what you want instrumented and where it goes away from the developer and places this as a Configuration Package which means you could change this without changing the code if required. Has the ability of configuring inputs to be based on keywords or specific events which provides powerful flexibility.
Disadvantages: Fiddly to setup up. EventFlow works In Process, so this configuration is probably not best for high performance services as you are effectively making a connection to App Insights from the service directly. For high performance, I would look at Scenario 3.
Scenario 3: Azure Diagnostics
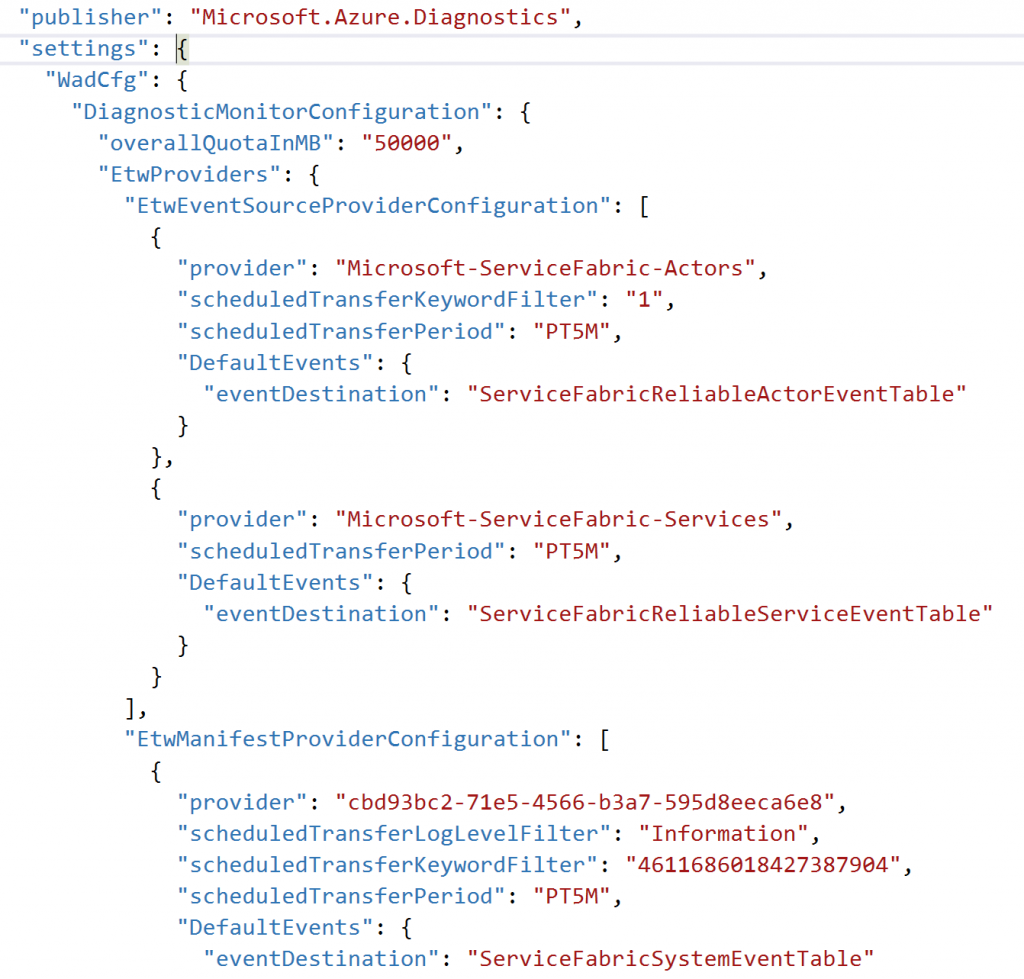
It is common to setup a cluster with Azure Diagnostics installed within each instance in the Scale Set. This means that we could just configure Azure Diagnostics to take defined provider names from each node and store them in a storage account of our choosing. The beauty of this solution is that Azure Diagnostics runs in its own process and would take all of the events from those providers across all the nodes. However, if we had a We ended up collecting the "Microsoft-ServiceFabric-Services" and "Microsoft-ServiceFabric-Actors" providers using this mechanism.
[caption id="attachment_416" align="alignnone" width="1024"] Defined in the Virtual Machine Scale Set of the cluster[/caption]
An alternative would be to make every service in your cluster write to a canonical Event Source and then that was collected on each node, but I don't believe that was the design.
Advantages: Very simple, didn't affect the running service as another process was responsible for submitting the telemetry to Application Inisghts
Disadvantages: In order to configure the Azure Diagnostics ETWListener you need to configure each Provider Name in the ARM Template. This is fine if you own the cluster and are able to add a new provider each time you add a new service, but I believe that this will quickly become unmanageable if you have 1000's of different service types. Maybe it would be best to agree on a common provider name and push all ETW events through this.
Summary
After much experimentation I decided to rely on Azure Diagnostics to surface "Microsoft-ServiceFabric-Services" and "Microsoft-ServiceFabric-Actors" events into Application Insights and use EventFlow to send application events

