What’s new with T4 in Visual Studio 2012 Release Candidate
I’m a bit quicker off the mark than I was with our Beta as this is my first day back from vacation after our Release Candidate has launched. We have one final significant T4 feature to add for Visual Studio 2012 in addition to all of the stuff from out beta and developer previews, and it’s a doozy!
- T4 template debugging
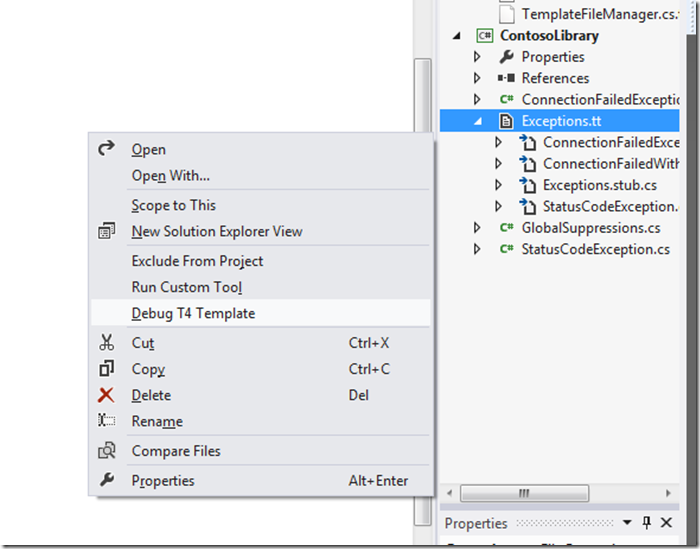
In past releases of Visual Studio, debugging T4 templates has been a little more work than we’d like, so we’ve addressed that in this release with a simple to use but full-featured debugging experience:
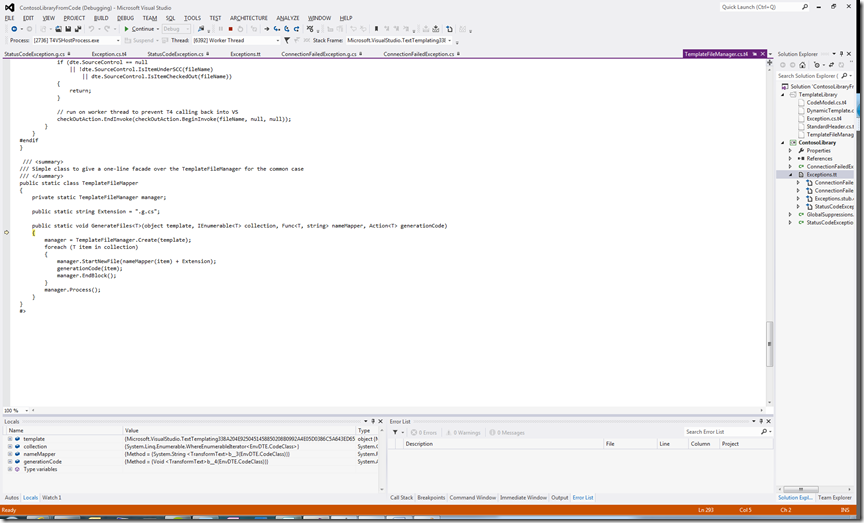
You’ll see the ‘Debug T4 Template’ menu item above on the context menu for the template in the Solution Explorer. There’s no need to set the debug flag on the template directive or any other special magic; just set a breakpoint in your T4 template and launch the debugger. You’ll have full access to step through your template code and look at variables in the locals window.
There’s also new service interface, IDebugTextTemplating, to allow folks who use T4’s Visual Studio API to call T4 asynchronously under the debugger and so build equivalent debugging facilities into their tools, plus a couple of new support pieces under the hood to enable all this whilst maintaining backward compatibility on our existing interfaces.
I hope you enjoy the new productivity of debugging your T4 templates in our release candidate!
Technorati Tags: T4,Visual Studio 2012,Release Candidate,Debugging
Comments
Anonymous
June 05, 2012
Are you guys planning some syntax highlight support for T4 Templates for the 2012 Final Release?Anonymous
June 07, 2012
Why is there still no T4 template highlighting ?Anonymous
June 19, 2012
No, the debugger made it in this time, but the story for syntax highlighting for this release is still 3rd party extensions.Anonymous
June 27, 2012
Still no T4 syntax highlighting/intellisense in T4s after the huge push by MSFT to get T4s to be a bigger part of .NET strategy? MSFT ought to be embarrassed, there is no excuse for an oversight like that. Another 2 years of tracking down 3rd party support for something that ought to be built-in. Especially for a product that exceeds $1000!!Anonymous
July 11, 2012
Is it possible to debug the include files?Anonymous
July 11, 2012
Yes, it debugs include files. It's not yet super-reliable debugging templates that do a lot of access back to the host's DTE, such as the entity framework's templates. We're looking at improving that scenario for an update release.Anonymous
July 12, 2012
Yes I saw it this morning and it's really very cool even if I always want better improvements.Anonymous
July 15, 2012
It doesn't seem like the debugger respects assembly references with Macro (VS Environment Variable paths) i.e.: <#@ assembly name="$(ProjectDir)..Tools.SchemabinDebugTools.Schema.dll" #> I get an error saying the host threw an exception while resolving the assembly reference.Anonymous
July 16, 2012
Can you log a connect bug with some repro steps at connect.microsoft.com/visualstudioAnonymous
August 09, 2012
Nice going Gareth (and Tim)! Don't listen to the haters, I'm glad you chose debugging over syntax highlighting.Anonymous
August 16, 2012
Any place where T4 lovers can vote for the top wanted features?Anonymous
August 16, 2012
Yes - please use UserVoice - visualstudio.uservoice.com/.../121579-visual-studioAnonymous
November 11, 2012
Hi Gareth, I just uploaded to codeplex some sample usage of T4 (version for VStudio 2012). It's serialization framework that is about 10 times faster then binary serialization provided as part of .Net Framework and produces about 10 times smaller result sets :) It shows many interesting aspects of T4 usage :) http://bitcare.codeplex.com/ Kind Regards, Aleksander Stankiewicz

