Visual Studio 2013 Preview: Code Map Debugger Integration
Prologue
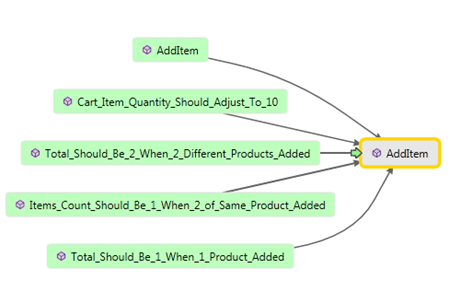
The original Code Map was introduced in the product with Visual Studio 2012 Update 1. You need to read my original post before moving on:
My assessment at the time was that it was a good feature but had poor performance and didn’t really add much value relative to Dependency Graphs. With debugger integration however Code Maps have definitely come into their own and the performance is very good.
Note: Code Map Debugger Integration is a feature in the Ultimate edition of Visual Studio.
Code Map Debugger Integration
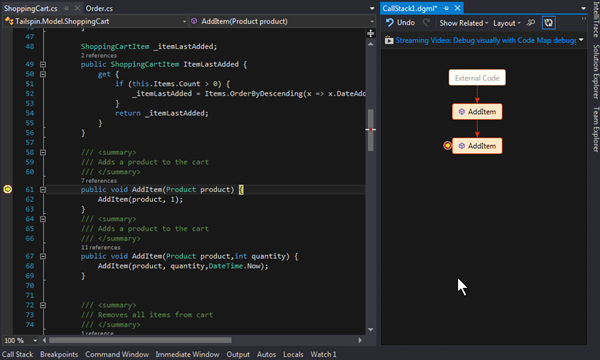
Assuming you have a handle on Code Maps now let’s see how the debugger integration works. First, I’ll take the TailSpin Toys sample code and set a breakpoint within the code base (ShoppingCart.cs, line 61):
I’ll press F5 and add an item to my cart to trigger the debugger:
Ordinarily, we would step though the code and hope we remember how we got to a particular place. Those days are gone! Now we can turn on the Code Map feature while debugging:
You can also find this on the Menu Bar at Debug | Show Call Stack on Code Map:
You will see a Code Map in sync with the debugger at this point. You can create Code Maps in C#, VB, C++, JavaScript currently. Once activated all future debugging sessions will include a Code Map until you turn this feature off:
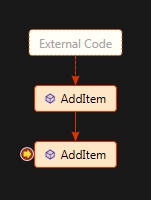
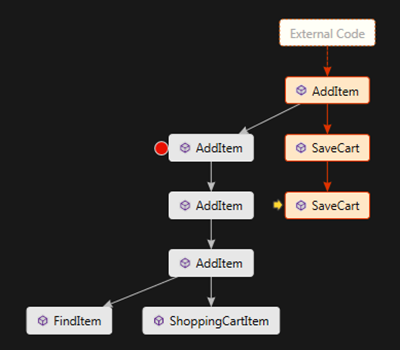
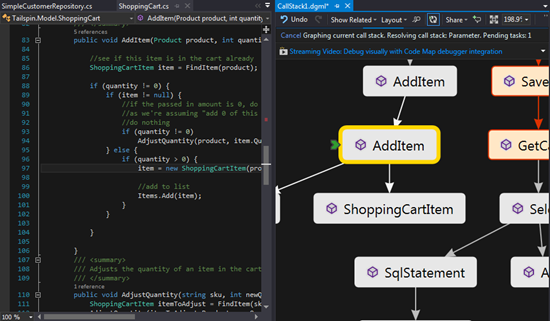
If we take a closer look at the current map, we can see that it shows how we arrived at the current call (the squares above the last AddItem call) and our current location (yellow arrow). Although the current location indicator is partially covering it, you can also see the breakpoint indicator:
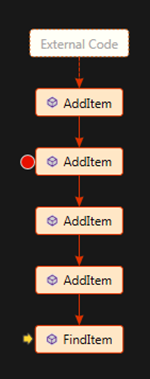
Stepping through the code we see the map keeps updating so we don’t have to keep the path in our heads:
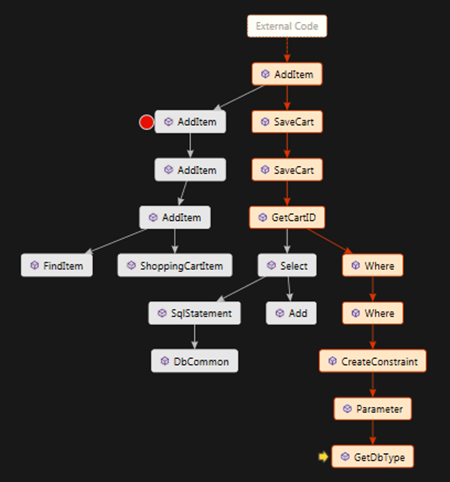
The Code Map will continue to update for our debugging session showing where we have been and where we currently are in the call stack:
The graphs can get quite large:
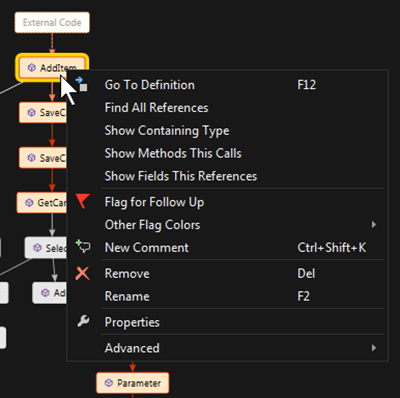
For this reason it’s important to use the map tools at your disposal. The context menu items when you Right Click any node are a great example of common tools:
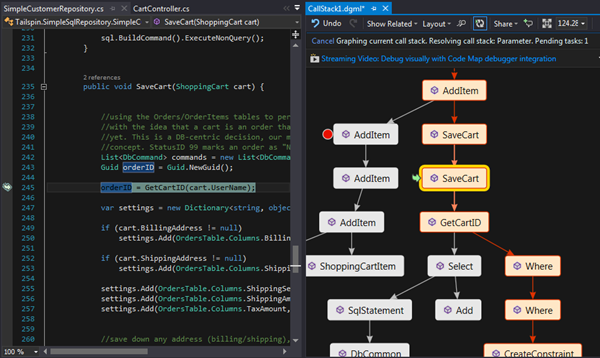
You can Double Click any node to view the code from that location in the stack. A green arrow will indicate your current position:
If you happen to choose a node that isn’t part of the current active call stack then you will get a slightly different indicator:
When you stop debugging the Code Map will be preserved so you can save it if desired and keep a map of the code base you just went through. I think this is an exceptional addition to the debugging experience!
Comments
Anonymous
August 13, 2013
Looks quite nice, will there be a "Map my whole application" button? It may not be very useful and take ages to map everything, but it would awesome to see the huge tree :)Anonymous
August 13, 2013
Hey Bob :) There already is a "Map my whole application" feature in Ultimate and it is one of my favorite features ever. The feature is called Dependency Graph. You can go here for more information: msdn.microsoft.com/.../dd409453.aspx ZAnonymous
August 14, 2013
Is the dependency graph/code map information available through the extensibility APIs? I remember trying to get access to "Find All References" type information from an extension being very difficult previously; it would seem ReSharper and CodeRush both implement their own parsing/dependency models and NDepend also has a library I considered, but given how much dependency presentation has improved (view references inline with code, for example) I'm really hoping the API has improved along with it. I've already thought of some super handy extensions that would be great. Code reviews supported by auto-mapping SCC diffs to impacted code paths, anybody? Or maybe detecting code paths that aren't backed by unit tests? The API does not provide a fast enough or robust enough method of querying this information in 2012/10 (to my knowledge anyway), so implementing extensions of this variety involves reinventing not only the wheel, but the engine, driveshaft, and transmission as well, which costs more memory and CPU time, results in inconsistent behavior/user experience, requires separate maintenance, and so on. Either way, I'm super excited for this; just trying to get a feel for any welcome programmability changes that might come along with it. I'd consider updating my team to Ultimate just so we can improve the quality and decrease the time of code reviews. Thanks for the post, -JasonAnonymous
August 14, 2013
I don't get this ultimate whatever edition nonsense. Same with intellitrace, another very useful debugging feature that is only available in the most expensive visual studio edition. So those are features that only a selected few developers get... Why not make two editions only? Express and standard? Developers would get what they need and more vs licenses would be sold, it's a win winAnonymous
August 14, 2013
I am really excited for that feature. However, even if I'm an Ultimate user at home... I don't have such luxury where I work. I agree with Iñaki - there's no real reason to have the plethora of different editions - Express and Standard would be enough. The only thing different in the MSDN subscription would be the other features (ie - number of licenses, support requests, etc).Anonymous
August 16, 2013
This feature seems nice but has been very sluggish when I used it.Anonymous
August 16, 2013
Hey Blake :) Is the sluggishness consistent between sessions or just in particular places? I know this was a problem with the original Code Map feature but haven't seen it manifest in 2013. ZAnonymous
August 25, 2013
Hey Jason :) I just realized I didn't respond to your question. So there are multiple layers to working with the graphs. Here is where you can find most of what you need: msdn.microsoft.com/.../dd409453.aspx I haven't personally seen any programmatic use to create the graphs but I know they can be manipulated with code once created. ZAnonymous
September 04, 2013
Thanks kindly :) I'm most especially interested in using git diffs with code maps to visualize all affected code from a commit (or range of commits). No chance this is already on the board, eh? Wishful thinking, I'd guess, but I think that alone would save me many hours. View Call Hierarchy has already great, but it's still a little lacking in this area. I work on a very complex enterprise project and this is the first feature idea that has compelled me to be interested in Ultimate features. Thanks, -JasonAnonymous
October 02, 2013
zainnab: Do you happen to know what technology/framework was used to create the Code Map diagrams? Was it written in WPF/XAML, for example, or something else?Anonymous
November 20, 2013
Totally agree with the fact that having such vital features available only in the Ultimate edition is really bad management.. I think that 2 different editions would be much better: Express & Standard. The later would attract so many new developers even from different languages, which would make very positive effect to the current Microsoft products & environment...Anonymous
October 29, 2014
The comment has been removedAnonymous
March 08, 2015
Read the prologue: "Note: Code Map Debugger Integration is a feature in the Ultimate edition of Visual Studio."
