Getting started with Data Explorer basic mode
Important
The Data Explorer feature is in public preview. We anticipate ongoing changes to it as we continue gathering feedback and optimizing for customer use.
Data Explorer basic mode is designed to let you quickly discover insights in your event data without requiring query language knowledge. This non-technical query building experience enables users to explore their data quickly. To learn how to write more complex queries, see the Getting Started with Data Explorer (advanced) tutorial.
Authoring custom queries
To begin authoring your own queries in basic mode, it's important to first understand the shape of the data you're accessing.
The events.all table
The events.all table is the default destination for all incoming events. It's a single semi-structured table with columns for common values such as time & event name. You'll quickly become familiar with the EventData column, which contains the full original JSON payload and is useful in almost all queries. You can read the following documentation on the events.all table.
Query
A query is composed of one or more Conditions that are combined via the 'OR' logical operator. A condition is composed of an Event from the event.all table.
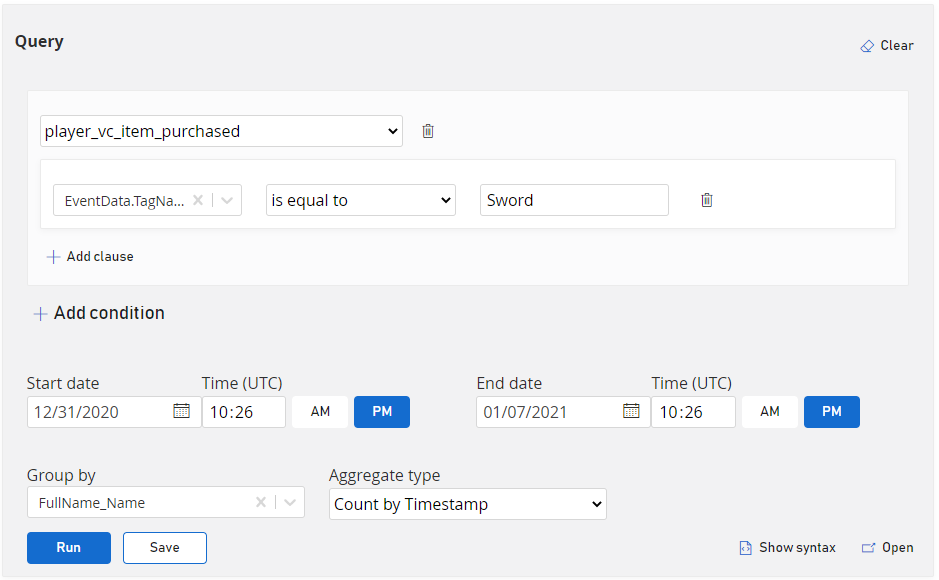
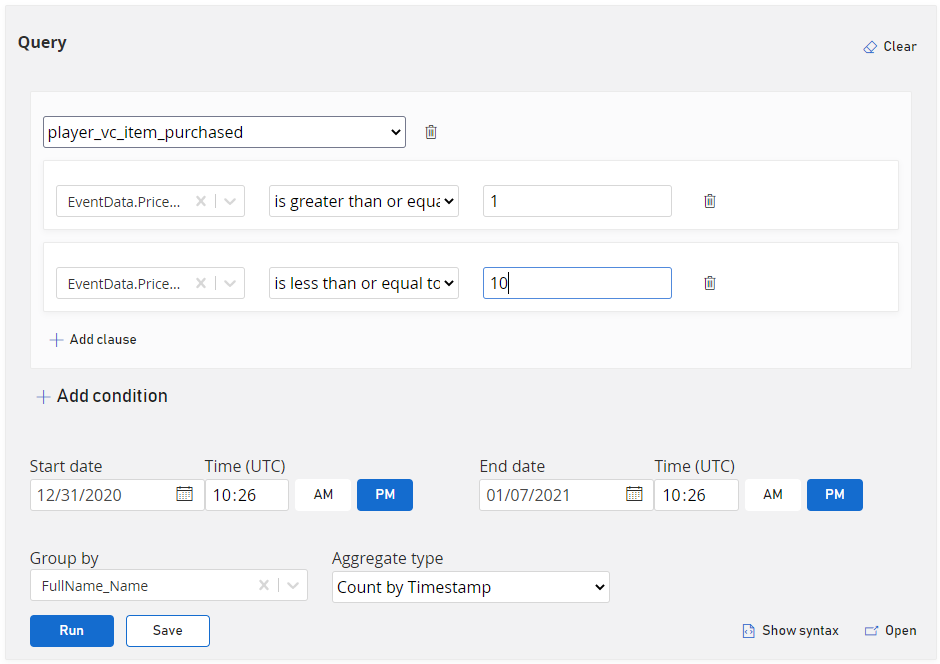
Complex conditions can be created by adding one or more Clauses, which is a logical statement composed of a Variable, Operator, and Value, to a condition. Clauses are combined via the 'AND' logical operator. The Variables listed in the dropdown are populated based upon the Event selected when creating the Condition.
The timeframe of the query can be adjusted by modifying Start date and End date.
The output of the query can be modified further by adding Group By and Aggregate Type. Group By modifies how the output rows are grouped, whereas Aggregate Type modifies how the rows are counted, summed, or distinct by.
You can create queries in the Query panel. Note that Data Explorer (basic) queries will only reference the top 100 events. To view all events, run the query in Data Explorer (advanced).
Query Output
After running a query, you can see the output below in the Query Output panel. The output is in the format of a bar graph as well as a table.
The graph shows the results for the largest five groups. You can see the other groups by clicking the dropdown at the bottom of the graph.
The table shows the Event Name, Timestamp (UTC), Player ID, and Event Data (via JSON) for reach row.
Sample Queries
Single Condition Queries
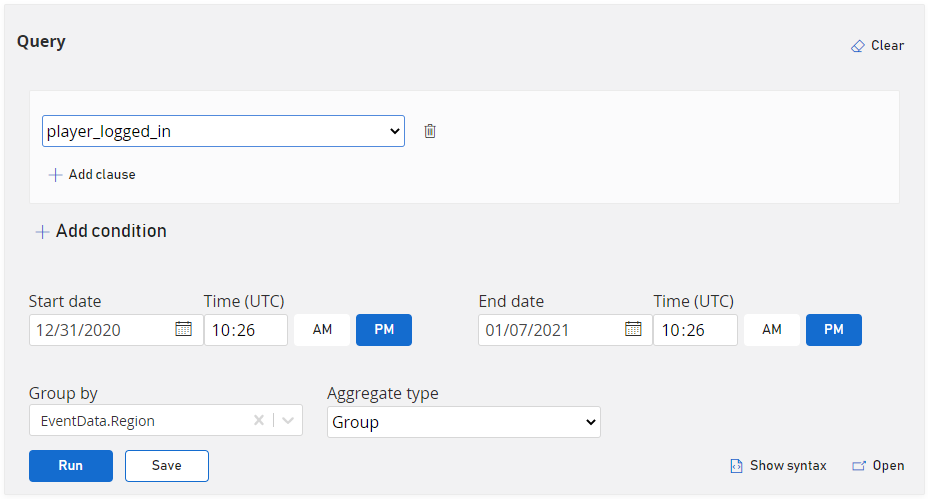
What regions are players logging in from this week?
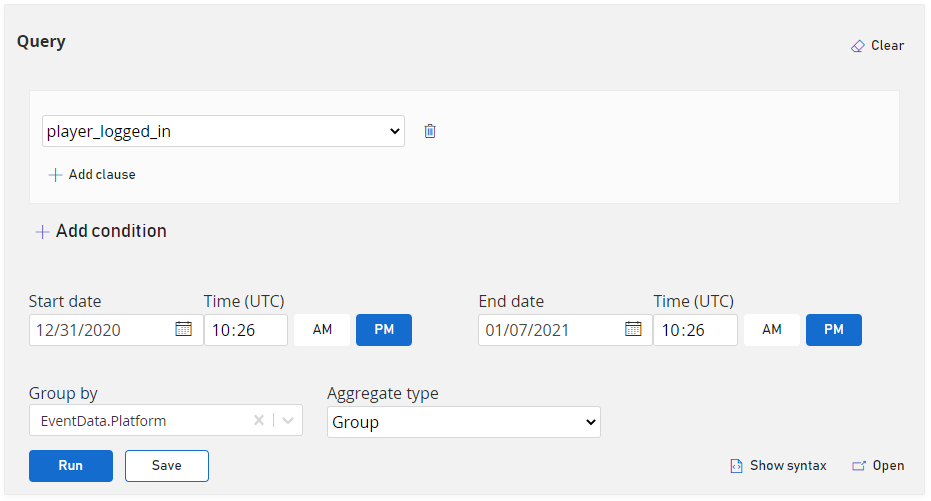
What devices are players logging in from this week?
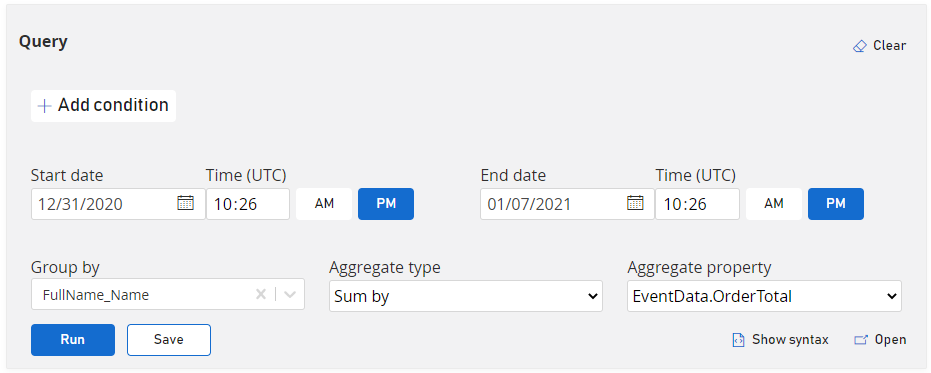
What's the sum of order totals this week?
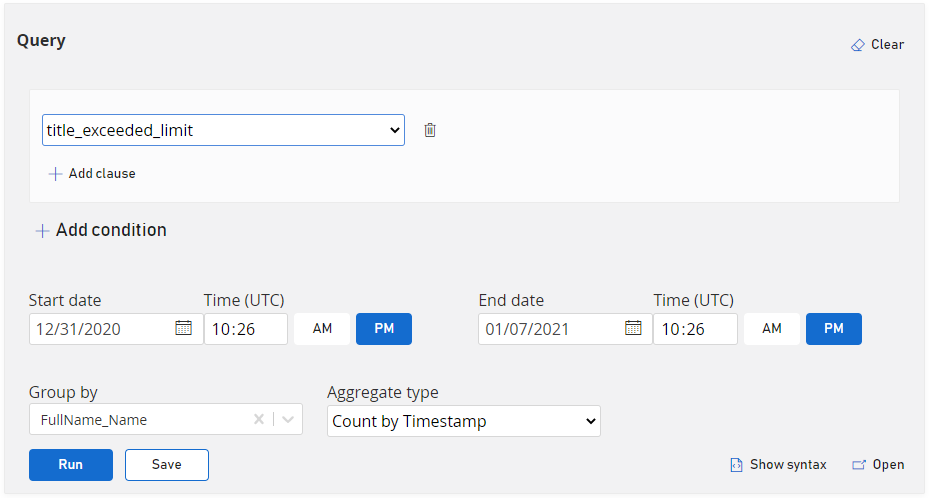
Are Playfab limits being exceeded?
Multi Condition Queries
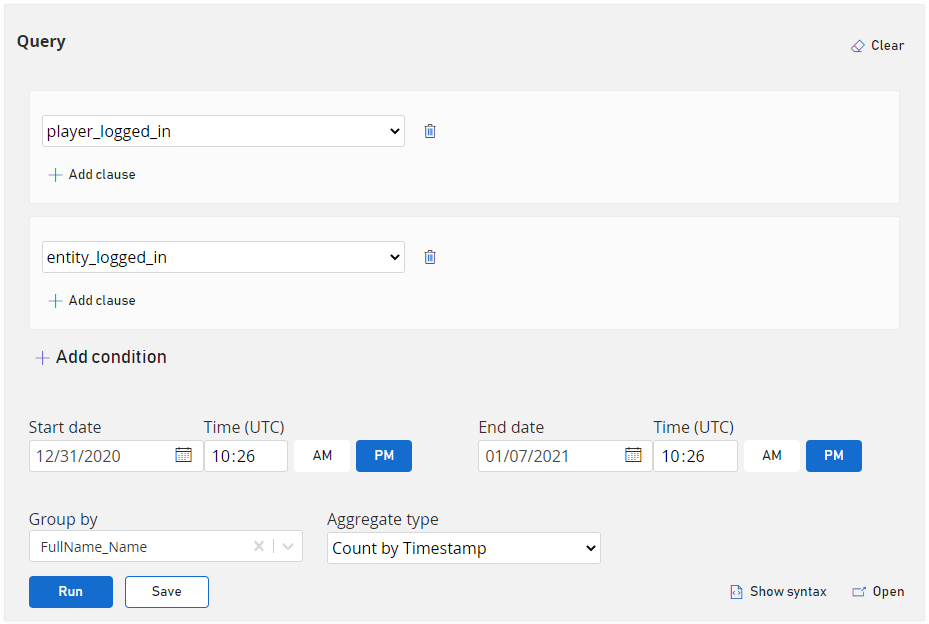
What players and entities are logging in this week?
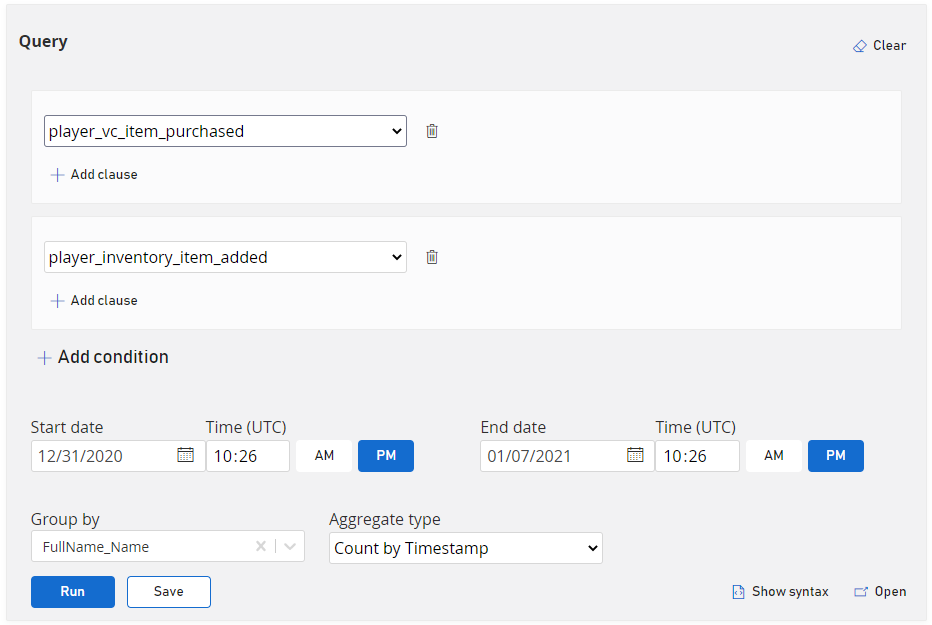
What items are being purchased or added to inventory this week?
Complex Condition Queries with Clauses
How many "sword" items were purchased this week?
How many items worth between $1 and $5 were purchased this week?
Example queries can be loaded into the Data Explorer basic by selecting “What’s This” and selecting a sample query.
Limits
There are two limits that govern Data Explorer query usage:
Max query runtime: An individual query isn't permitted to run longer than 30 seconds. If this limit is exceeded, the query will be terminated and you'll receive an error message.
Interval Usage: Each title is permitted a cumulative total runtime of three minutes per any given 10 minute interval. If this limit is exceeded, you'll receive an error message and will need to wait before running additional queries.
Data Retention
By default, Explorer queries run on hot storage, which can be configured in the Management tool. Queries that search beyond the data stored in hot storage will have significantly longer run times and may time out.