Kqlmagic is a command that extends the capabilities of the Python kernel in Azure Data Studio notebooks. You can combine Python and Kusto query language (KQL) to query and visualize data using rich Plotly library integrated with render commands. Kqlmagic brings you the benefit of notebooks, data analysis, and rich Python capabilities all in the same location. Supported data sources with Kqlmagic include Azure Data Explorer, Application Insights, and Azure Monitor logs.
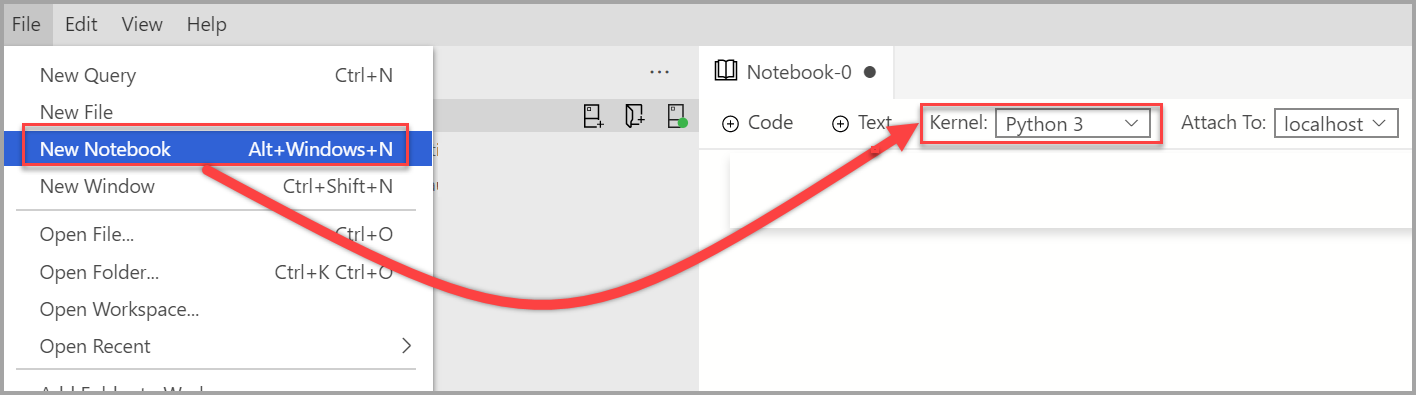
This article shows you how to create and run a notebook in Azure Data Studio using the Kqlmagic extension for an Azure Data Explorer cluster, an Application Insights log, and Azure Monitor logs.
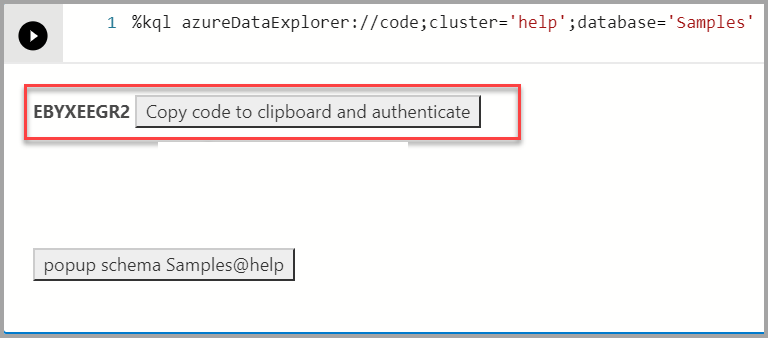
If you are using your own ADX cluster, you must include the region in the connection string as follows:
%kql azuredataexplorer://code;cluster='mycluster.westus';database='mykustodb'
You use device sign-in to authenticate. Copy the code from the output and select authenticate which opens a browser where you need to paste the code. Once you authenticate successfully, you can come back to Azure Data Studio to continue with the rest of the script.
Query and visualize for Azure Data Explorer
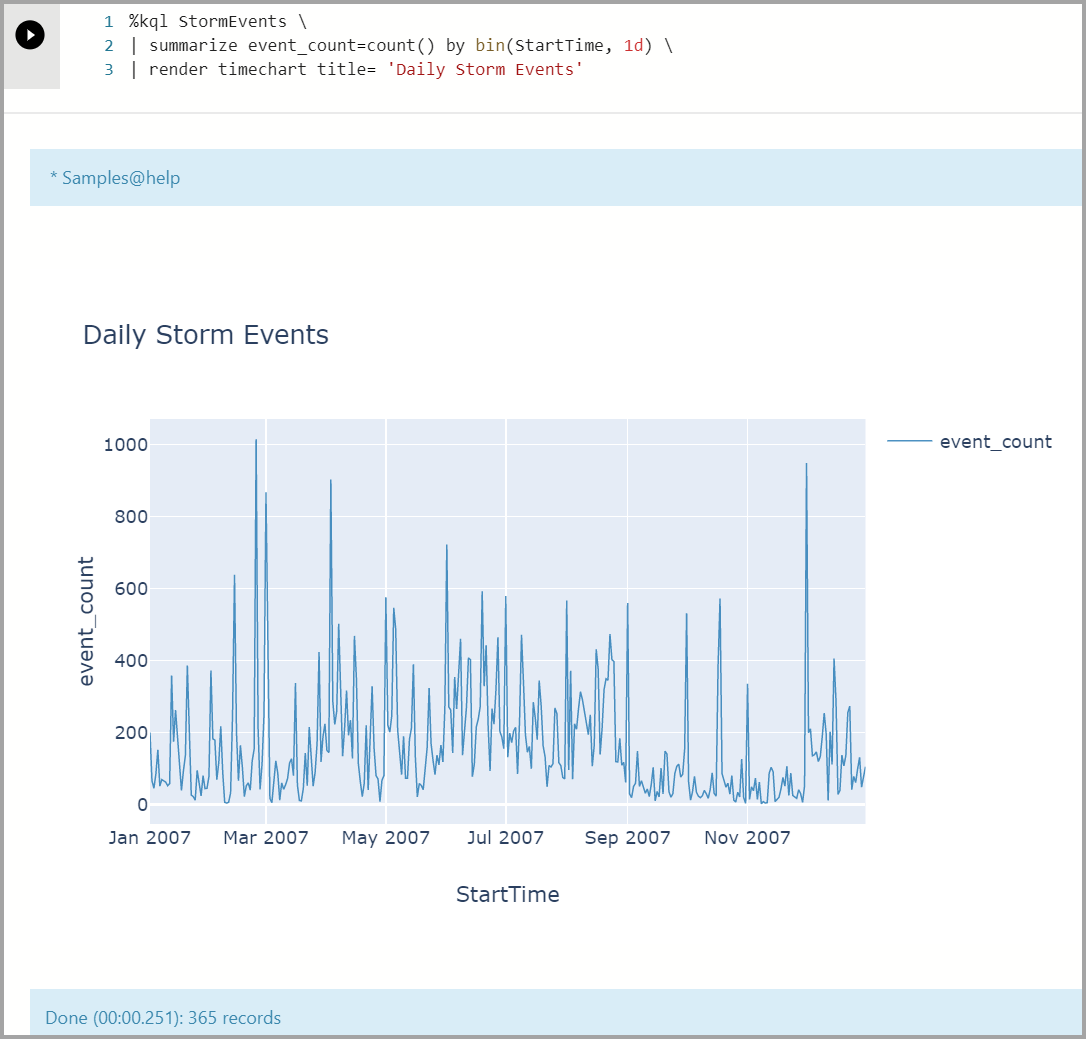
Query data using the render operator and visualize data using the plotly library. This query and visualization supplies an integrated experience that uses native KQL.
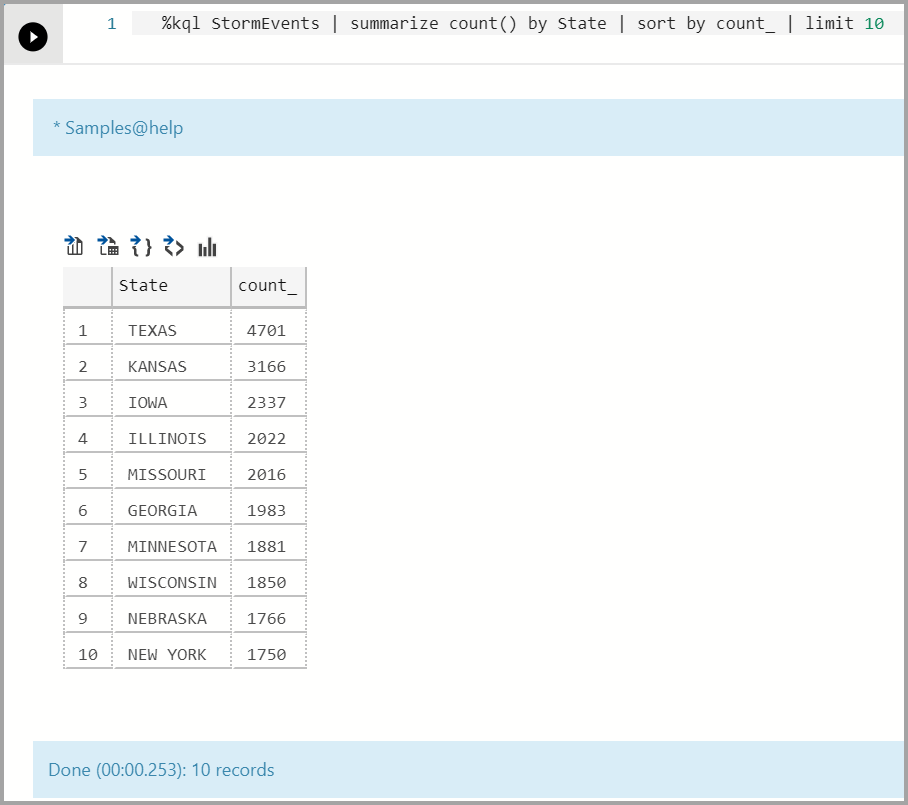
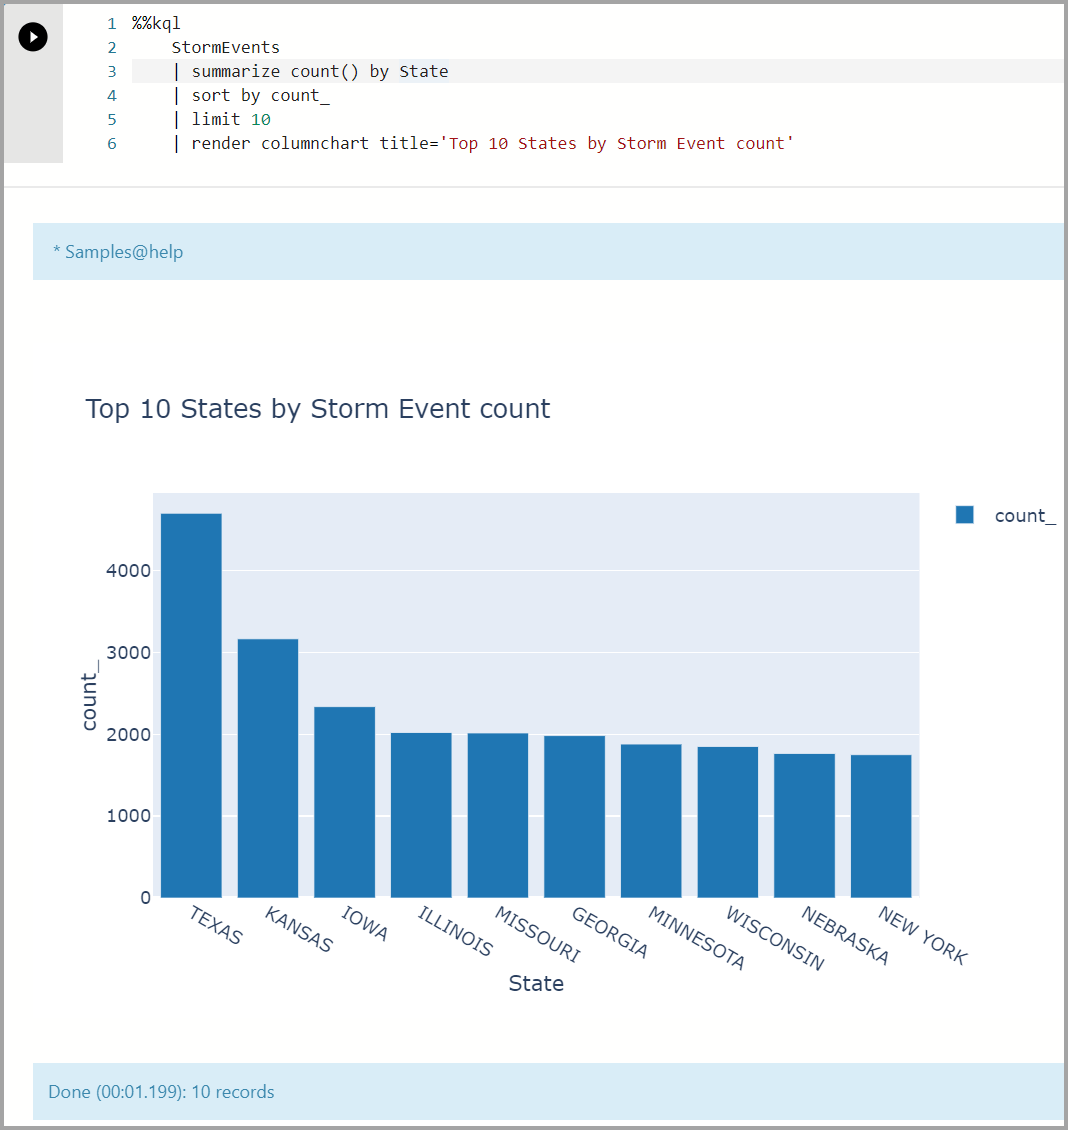
Analyze top 10 storm events by state and frequency:
Python
%kql StormEvents | summarize count() by State | sort by count_ | limit 10
If you're familiar with the Kusto Query Language (KQL), you can type the query after %kql.
%%kql
StormEvents
| summarize count() by State
| sort by count_
| limit 10
| render columnchart title='Top 10 States by Storm Event count'
Kqlmagic with Application Insights
Load and authenticate Kqlmagic for Application Insights
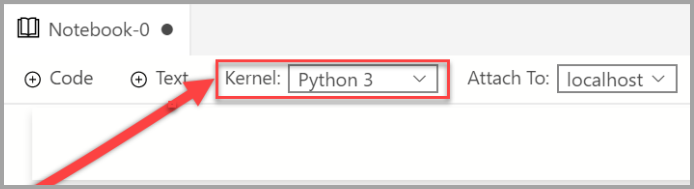
Verify the Kernel is set to Python3.
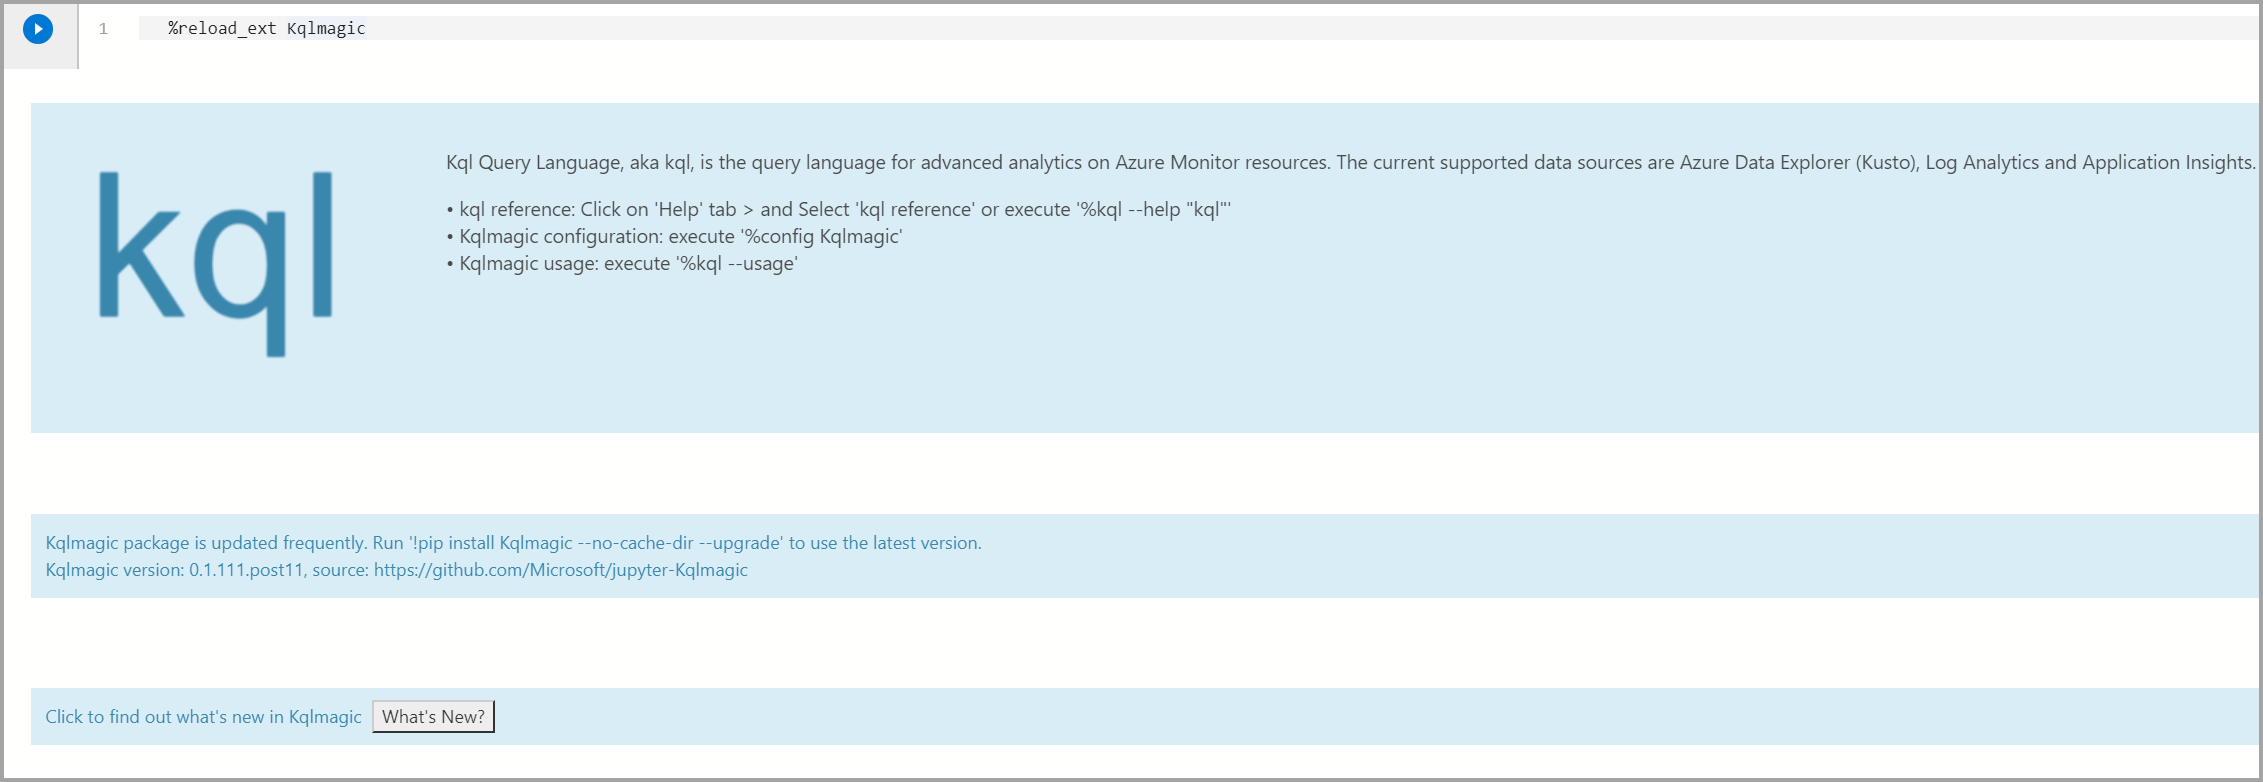
Load Kqlmagic:
Python
%reload_ext Kqlmagic
Notă
Every time you create a new notebook in Azure Data Studio you must load the Kqlmagic extension.
Connect and authenticate.
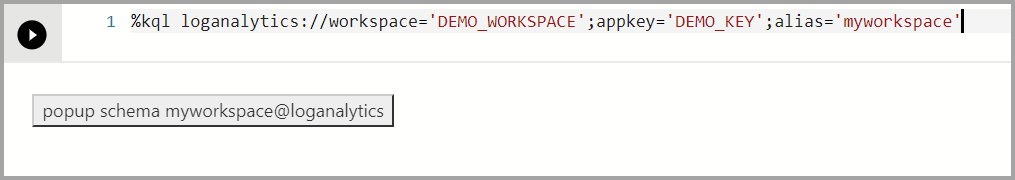
First, you must generate an API key for your Application Insights resource. Then, use the Application ID and API key to connect to Application Insights from the notebook:
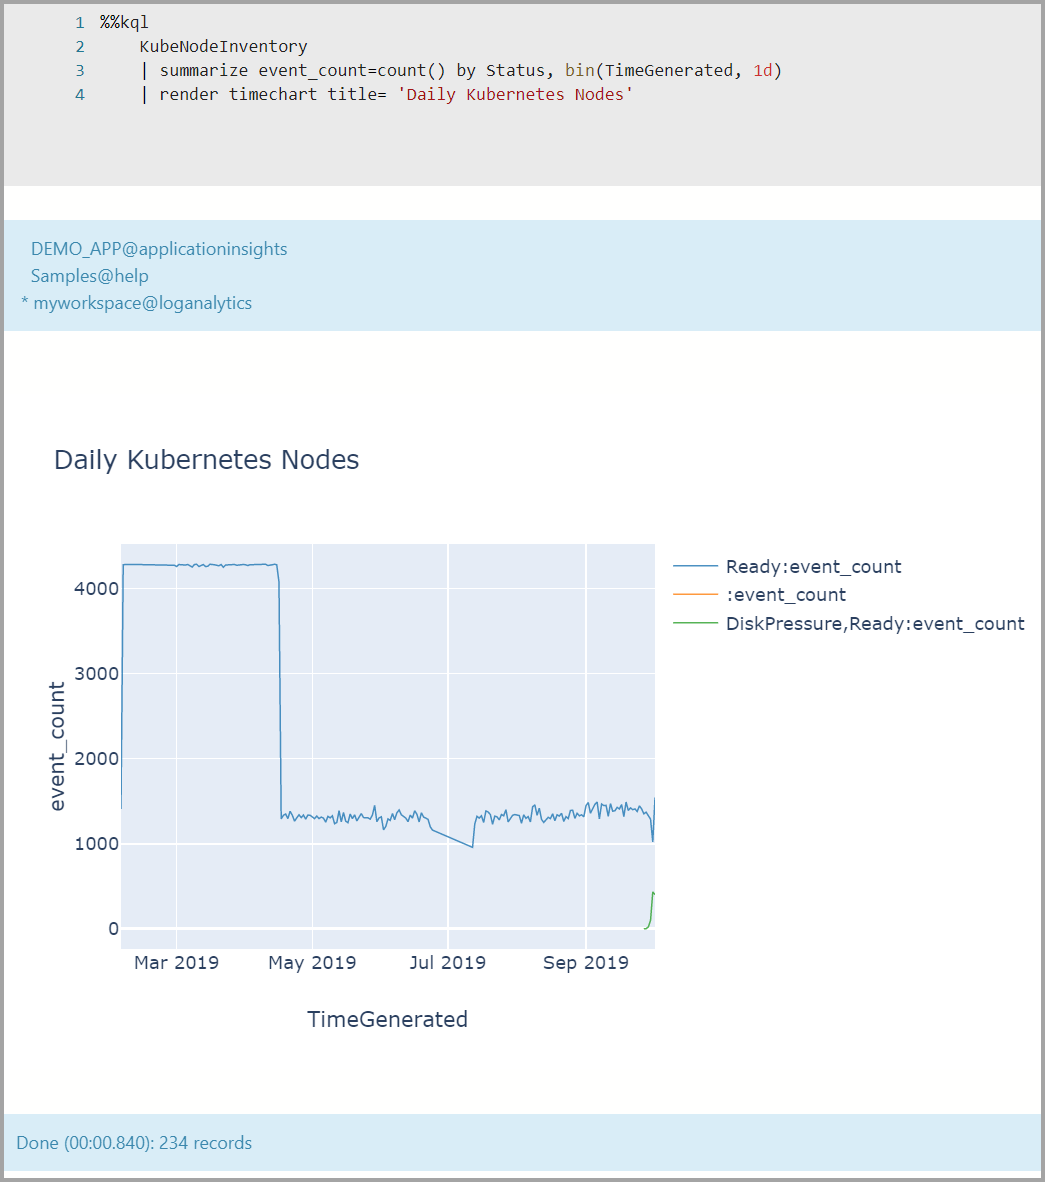
Query data using the render operator and visualize data using the plotly library. This query and visualization supplies an integrated experience that uses native KQL.
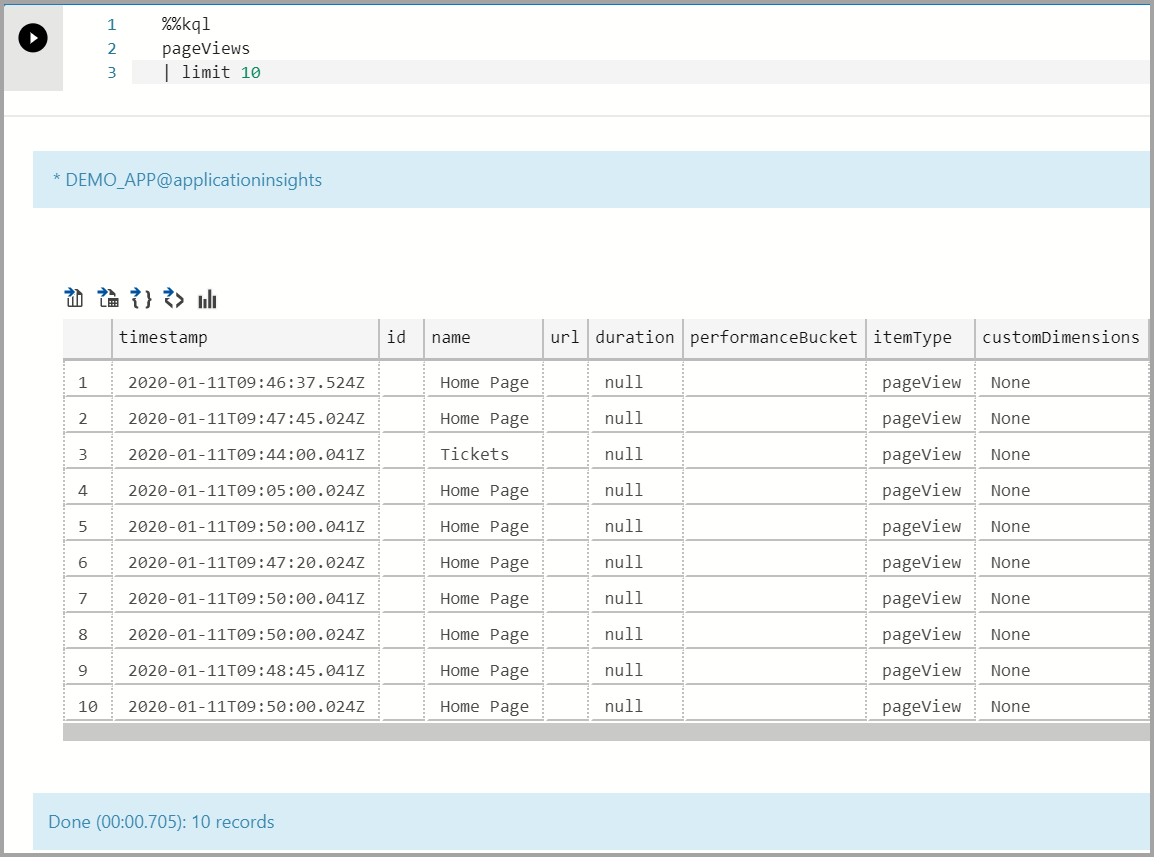
Show Page Views:
Python
%%kql
pageViews
| limit 10
Notă
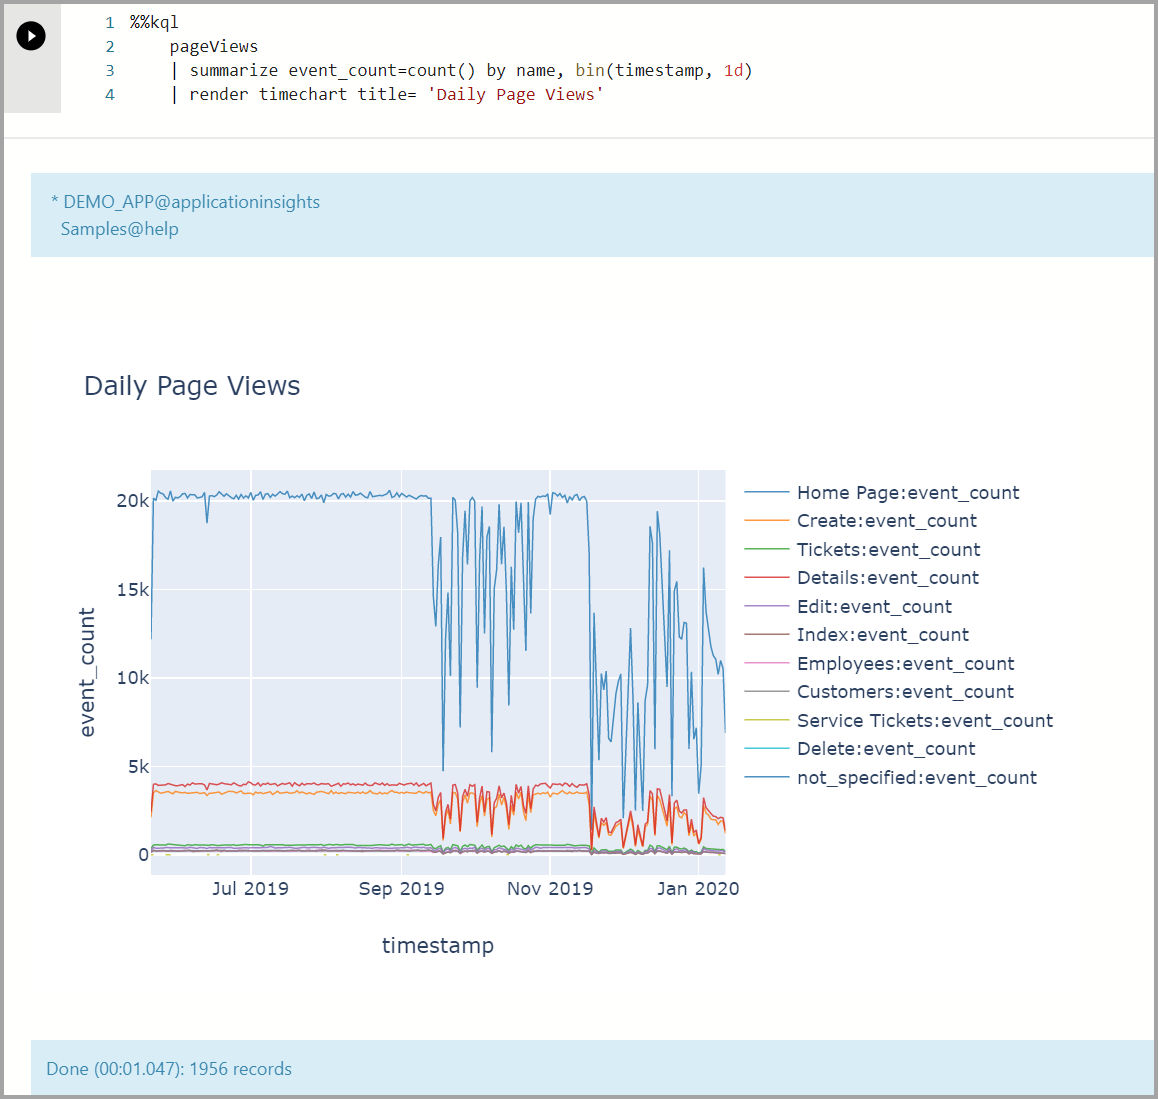
Use your mouse to drag on an area of the chart to zoom in to the specific date(s).
Query data using the render operator and visualize data using the plotly library. This query and visualization supplies an integrated experience that uses native KQL.
Gestionați ingestia și pregătirea datelor, instruirea și implementarea modelelor și monitorizarea soluțiilor de învățare programată cu Python, Azure Machine Learning și MLflow.