Azure ExpressRoute monitoring data reference
This article contains all the monitoring reference information for this service.
See Monitor Azure ExpressRoute for details on the data you can collect for ExpressRoute and how to use it.
Metrics
This section lists all the automatically collected platform metrics for this service. These metrics are also part of the global list of all platform metrics supported in Azure Monitor.
For information on metric retention, see Azure Monitor Metrics overview.
Note
Using GlobalGlobalReachBitsInPerSecond and GlobalGlobalReachBitsOutPerSecond are only visible if at least one Global Reach connection is established.
Supported metrics for Microsoft.Network/expressRouteCircuits
The following table lists the metrics available for the Microsoft.Network/expressRouteCircuits resource type.
- All columns might not be present in every table.
- Some columns might be beyond the viewing area of the page. Select Expand table to view all available columns.
Table headings
- Category - The metrics group or classification.
- Metric - The metric display name as it appears in the Azure portal.
- Name in REST API - The metric name as referred to in the REST API.
- Unit - Unit of measure.
- Aggregation - The default aggregation type. Valid values: Average (Avg), Minimum (Min), Maximum (Max), Total (Sum), Count.
- Dimensions - Dimensions available for the metric.
- Time Grains - Intervals at which the metric is sampled. For example,
PT1Mindicates that the metric is sampled every minute,PT30Mevery 30 minutes,PT1Hevery hour, and so on. - DS Export- Whether the metric is exportable to Azure Monitor Logs via diagnostic settings. For information on exporting metrics, see Create diagnostic settings in Azure Monitor.
| Category | Metric | Name in REST API | Unit | Aggregation | Dimensions | Time Grains | DS Export |
|---|---|---|---|---|---|---|---|
| Circuit Availability | Arp Availability ARP Availability from MSEE towards all peers. |
ArpAvailability |
Percent | Average | PeeringType, Peer |
PT1M | Yes |
| Circuit Availability | Bgp Availability BGP Availability from MSEE towards all peers. |
BgpAvailability |
Percent | Average | PeeringType, Peer |
PT1M | Yes |
| Circuit Traffic | BitsInPerSecond Bits ingressing Azure per second |
BitsInPerSecond |
BitsPerSecond | Average | PeeringType, DeviceRole |
PT1M | Yes |
| Circuit Traffic | BitsOutPerSecond Bits egressing Azure per second |
BitsOutPerSecond |
BitsPerSecond | Average | PeeringType, DeviceRole |
PT1M | Yes |
| Fastpath | FastPathRoutesCount Count of fastpath routes configured on circuit |
FastPathRoutesCountForCircuit |
Count | Maximum | <none> | PT5M, PT15M, PT30M, PT1H, PT6H, PT12H, P1D | Yes |
| GlobalReach Traffic | GlobalReachBitsInPerSecond Bits ingressing Azure per second |
GlobalReachBitsInPerSecond |
BitsPerSecond | Average | PeeredCircuitSKey |
PT1M | No |
| GlobalReach Traffic | GlobalReachBitsOutPerSecond Bits egressing Azure per second |
GlobalReachBitsOutPerSecond |
BitsPerSecond | Average | PeeredCircuitSKey |
PT1M | No |
| Circuit Qos | DroppedInBitsPerSecond Ingress bits of data dropped per second |
QosDropBitsInPerSecond |
BitsPerSecond | Average | <none> | PT5M, PT15M, PT30M, PT1H, PT6H, PT12H, P1D | Yes |
| Circuit Qos | DroppedOutBitsPerSecond Egress bits of data dropped per second |
QosDropBitsOutPerSecond |
BitsPerSecond | Average | <none> | PT5M, PT15M, PT30M, PT1H, PT6H, PT12H, P1D | Yes |
Supported metrics for Microsoft.Network/expressRouteCircuits/peerings
The following table lists the metrics available for the Microsoft.Network/expressRouteCircuits/peerings resource type.
- All columns might not be present in every table.
- Some columns might be beyond the viewing area of the page. Select Expand table to view all available columns.
Table headings
- Category - The metrics group or classification.
- Metric - The metric display name as it appears in the Azure portal.
- Name in REST API - The metric name as referred to in the REST API.
- Unit - Unit of measure.
- Aggregation - The default aggregation type. Valid values: Average (Avg), Minimum (Min), Maximum (Max), Total (Sum), Count.
- Dimensions - Dimensions available for the metric.
- Time Grains - Intervals at which the metric is sampled. For example,
PT1Mindicates that the metric is sampled every minute,PT30Mevery 30 minutes,PT1Hevery hour, and so on. - DS Export- Whether the metric is exportable to Azure Monitor Logs via diagnostic settings. For information on exporting metrics, see Create diagnostic settings in Azure Monitor.
| Metric | Name in REST API | Unit | Aggregation | Dimensions | Time Grains | DS Export |
|---|---|---|---|---|---|---|
| BitsInPerSecond Bits ingressing Azure per second |
BitsInPerSecond |
BitsPerSecond | Average | <none> | PT1M | Yes |
| BitsOutPerSecond Bits egressing Azure per second |
BitsOutPerSecond |
BitsPerSecond | Average | <none> | PT1M | Yes |
Supported metrics for microsoft.network/expressroutegateways
The following table lists the metrics available for the microsoft.network/expressroutegateways resource type.
- All columns might not be present in every table.
- Some columns might be beyond the viewing area of the page. Select Expand table to view all available columns.
Table headings
- Category - The metrics group or classification.
- Metric - The metric display name as it appears in the Azure portal.
- Name in REST API - The metric name as referred to in the REST API.
- Unit - Unit of measure.
- Aggregation - The default aggregation type. Valid values: Average (Avg), Minimum (Min), Maximum (Max), Total (Sum), Count.
- Dimensions - Dimensions available for the metric.
- Time Grains - Intervals at which the metric is sampled. For example,
PT1Mindicates that the metric is sampled every minute,PT30Mevery 30 minutes,PT1Hevery hour, and so on. - DS Export- Whether the metric is exportable to Azure Monitor Logs via diagnostic settings. For information on exporting metrics, see Create diagnostic settings in Azure Monitor.
| Category | Metric | Name in REST API | Unit | Aggregation | Dimensions | Time Grains | DS Export |
|---|---|---|---|---|---|---|---|
| Traffic | Bits In Per Second Bits per second ingressing Azure via ExpressRoute Gateway which can be further split for specific connections |
ErGatewayConnectionBitsInPerSecond |
BitsPerSecond | Average | ConnectionName |
PT1M | No |
| Traffic | Bits Out Per Second Bits per second egressing Azure via ExpressRoute Gateway which can be further split for specific connections |
ErGatewayConnectionBitsOutPerSecond |
BitsPerSecond | Average | ConnectionName |
PT1M | No |
| Scalability | Active Flows Number of Active Flows on ExpressRoute Gateway |
ExpressRouteGatewayActiveFlows |
Count | Average, Minimum, Maximum | roleInstance |
PT5M, PT15M, PT30M, PT1H, PT6H, PT12H, P1D | No |
| Performance | Bits Received Per second Total Bits received on ExpressRoute Gateway per second |
ExpressRouteGatewayBitsPerSecond |
BitsPerSecond | Average, Minimum, Maximum | roleInstance |
PT5M, PT15M, PT30M, PT1H, PT6H, PT12H, P1D | No |
| Scalability | Count Of Routes Advertised to Peer Count Of Routes Advertised To Peer by ExpressRoute Gateway |
ExpressRouteGatewayCountOfRoutesAdvertisedToPeer |
Count | Maximum | roleInstance, BgpPeerAddress |
PT5M, PT15M, PT30M, PT1H, PT6H, PT12H, P1D | Yes |
| Scalability | Count Of Routes Learned from Peer Count Of Routes Learned From Peer by ExpressRoute Gateway |
ExpressRouteGatewayCountOfRoutesLearnedFromPeer |
Count | Maximum | roleInstance, BgpPeerAddress |
PT5M, PT15M, PT30M, PT1H, PT6H, PT12H, P1D | Yes |
| Performance | CPU utilization CPU Utilization of the ExpressRoute Gateway |
ExpressRouteGatewayCpuUtilization |
Percent | Average, Minimum, Maximum | roleInstance |
PT5M, PT15M, PT30M, PT1H, PT6H, PT12H, P1D | Yes |
| Scalability | Frequency of Routes change Frequency of Routes change in ExpressRoute Gateway |
ExpressRouteGatewayFrequencyOfRoutesChanged |
Count | Total | roleInstance |
PT5M, PT15M, PT30M, PT1H, PT6H, PT12H, P1D | No |
| Scalability | Max Flows Created Per Second Maximum Number of Flows Created Per Second on ExpressRoute Gateway |
ExpressRouteGatewayMaxFlowsCreationRate |
CountPerSecond | Maximum | roleInstance, direction |
PT5M, PT15M, PT30M, PT1H, PT6H, PT12H, P1D | No |
| Scalability | Number of VMs in the Virtual Network Number of VMs in the Virtual Network |
ExpressRouteGatewayNumberOfVmInVnet |
Count | Maximum | <none> | PT5M, PT15M, PT30M, PT1H, PT6H, PT12H, P1D | No |
| Performance | Packets received per second Total Packets received on ExpressRoute Gateway per second |
ExpressRouteGatewayPacketsPerSecond |
CountPerSecond | Average, Minimum, Maximum | roleInstance |
PT5M, PT15M, PT30M, PT1H, PT6H, PT12H, P1D | No |
Supported metrics for Microsoft.Network/expressRoutePorts
The following table lists the metrics available for the Microsoft.Network/expressRoutePorts resource type.
- All columns might not be present in every table.
- Some columns might be beyond the viewing area of the page. Select Expand table to view all available columns.
Table headings
- Category - The metrics group or classification.
- Metric - The metric display name as it appears in the Azure portal.
- Name in REST API - The metric name as referred to in the REST API.
- Unit - Unit of measure.
- Aggregation - The default aggregation type. Valid values: Average (Avg), Minimum (Min), Maximum (Max), Total (Sum), Count.
- Dimensions - Dimensions available for the metric.
- Time Grains - Intervals at which the metric is sampled. For example,
PT1Mindicates that the metric is sampled every minute,PT30Mevery 30 minutes,PT1Hevery hour, and so on. - DS Export- Whether the metric is exportable to Azure Monitor Logs via diagnostic settings. For information on exporting metrics, see Create diagnostic settings in Azure Monitor.
| Metric | Name in REST API | Unit | Aggregation | Dimensions | Time Grains | DS Export |
|---|---|---|---|---|---|---|
| AdminState Admin state of the port |
AdminState |
Count | Average, Minimum, Maximum, Count | Link |
PT1M | Yes |
| FastPathRoutesCount Count of fastpath routes configured on port |
FastPathRoutesCountForDirectPort |
Count | Maximum | <none> | PT5M, PT15M, PT30M, PT1H, PT6H, PT12H, P1D | Yes |
| LineProtocol Line protocol status of the port |
LineProtocol |
Count | Average, Minimum, Maximum, Count | Link |
PT1M | Yes |
| BitsInPerSecond Bits ingressing Azure per second |
PortBitsInPerSecond |
BitsPerSecond | Average, Minimum, Maximum, Count | Link |
PT1M | No |
| BitsOutPerSecond Bits egressing Azure per second |
PortBitsOutPerSecond |
BitsPerSecond | Average, Minimum, Maximum, Count | Link |
PT1M | No |
| RxLightLevel Rx Light level in dBm |
RxLightLevel |
Count | Average, Minimum, Maximum, Count | Link, Lane |
PT1M | Yes |
| TxLightLevel Tx light level in dBm |
TxLightLevel |
Count | Average, Minimum, Maximum, Count | Link, Lane |
PT1M | Yes |
Metrics information
Follow links in these lists for more information about metrics from the preceding tables.
ExpressRoute circuits metrics:
- ARP Availability
- BGP Availability
- BitsInPerSecond
- BitsOutPerSecond
- DroppedInBitsPerSecond
- DroppedOutBitsPerSecond
- GlobalReachBitsInPerSecond
- GlobalReachBitsOutPerSecond
- FastPathRoutesCount
Note
Using GlobalGlobalReachBitsInPerSecond and GlobalGlobalReachBitsOutPerSecond will only be visible if at least one Global Reach connection is established.
ExpressRoute gateways metrics:
- Bits received per second
- CPU utilization
- Packets per second
- Count of routes advertised to peer
- Count of routes learned from peer
- Frequency of routes changed
- Number of VMs in virtual network
- Active flows
- Max flows created per second
ExpressRoute gateway connections metrics:
ExpressRoute Direct metrics:
- BitsInPerSecond
- BitsOutPerSecond
- DroppedInBitsPerSecond
- DroppedOutBitsPerSecond
- AdminState
- LineProtocol
- RxLightLevel
- TxLightLevel
- FastPathRoutesCount
ExpressRoute Traffic Collector metrics:
Circuits metrics
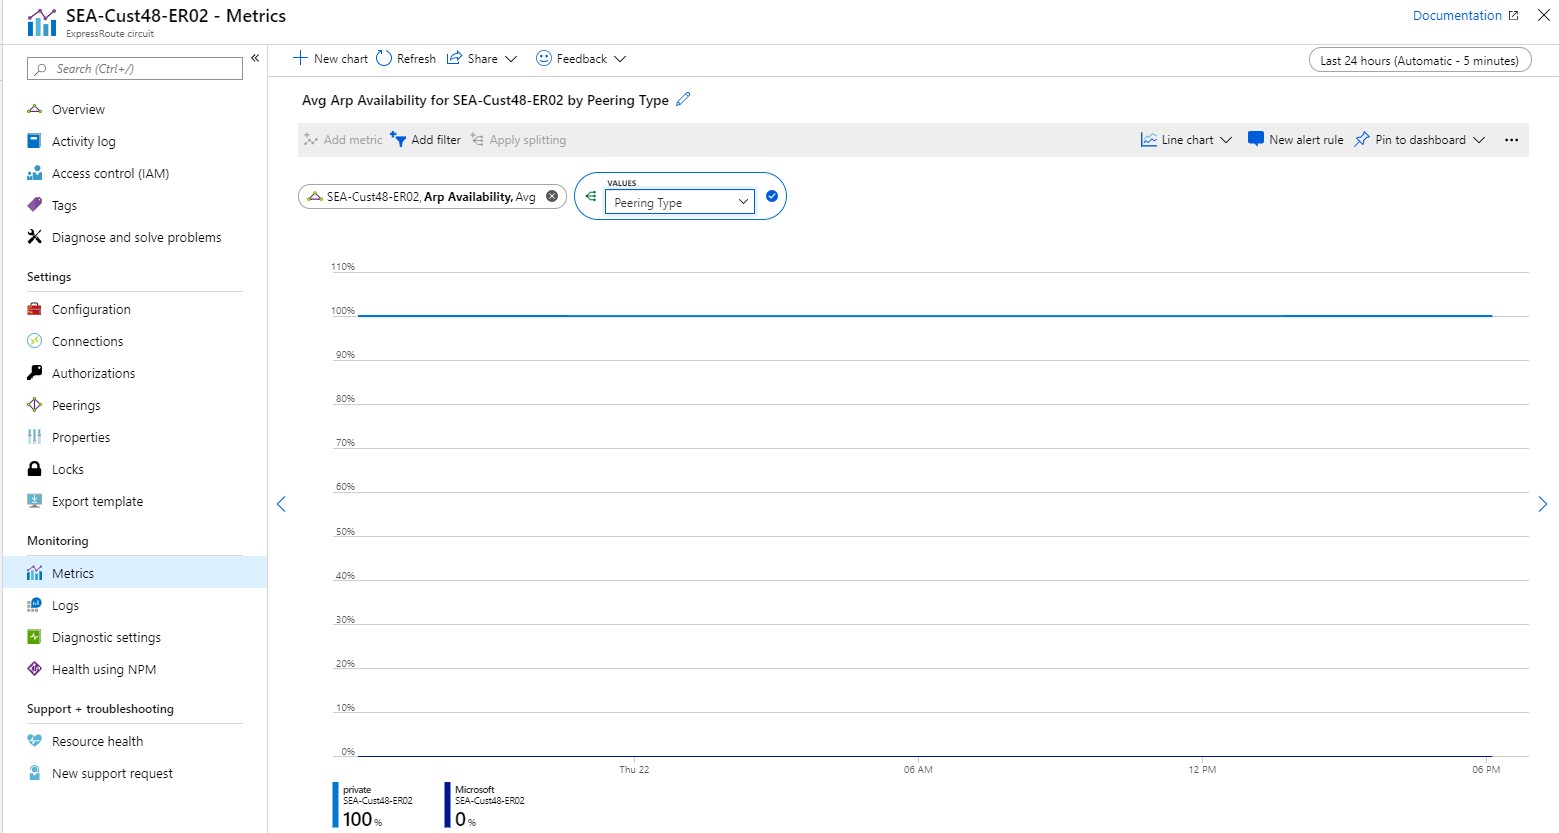
ARP Availability - Split by Peering
Aggregation type: Avg
You can view near to real-time availability of ARP (Layer-2 connectivity) across peerings and peers (Primary and Secondary ExpressRoute routers). This dashboard shows the Private Peering ARP session status is up across both peers, but down for Microsoft peering for both peers. The default aggregation (Average) was utilized across both peers.
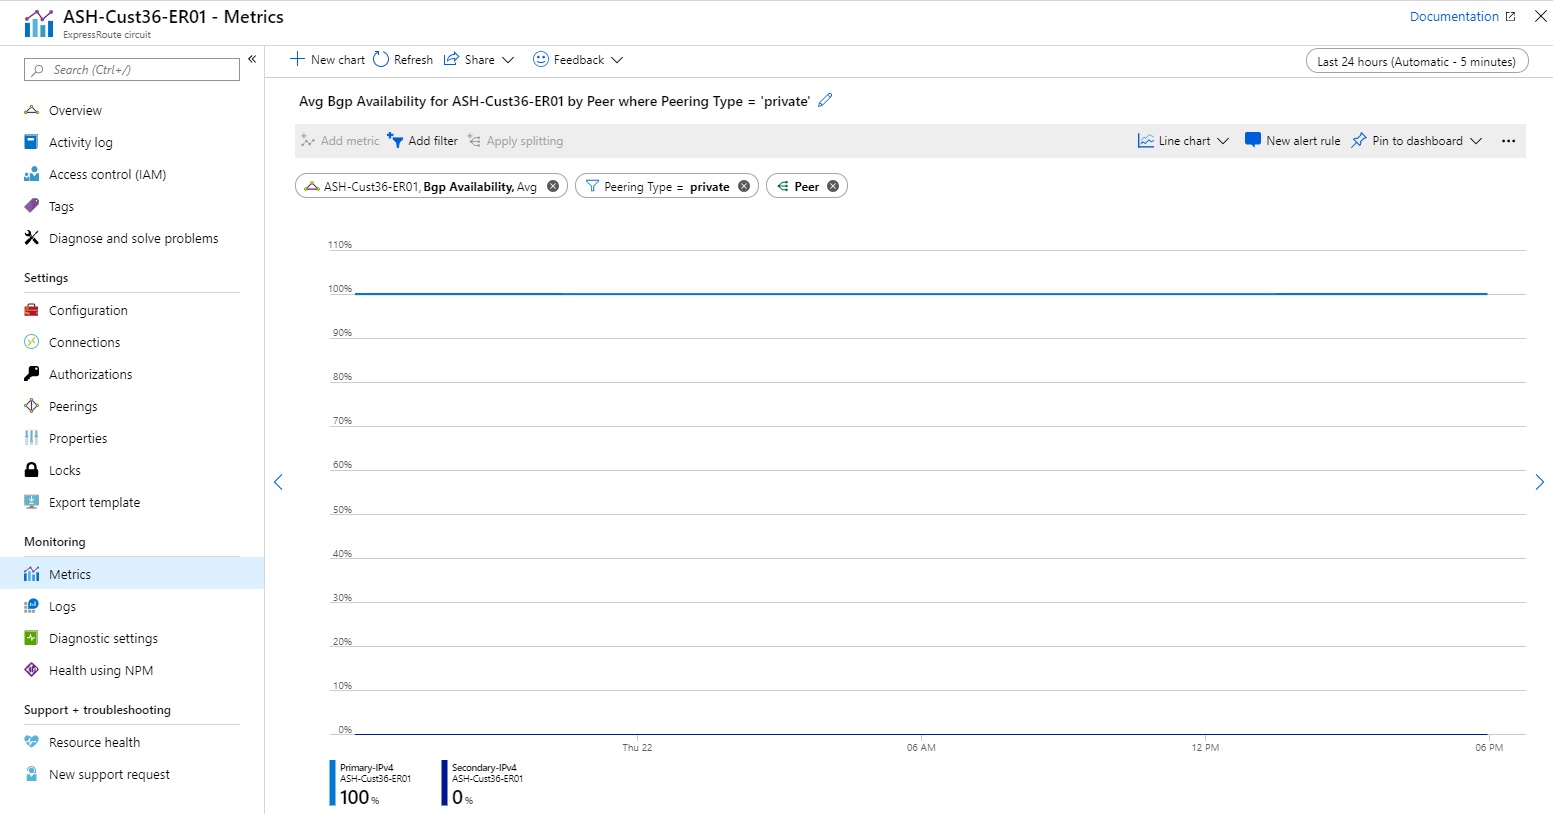
BGP Availability - Split by Peer
Aggregation type: Avg
You can view near to real-time availability of BGP (Layer-3 connectivity) across peerings and peers (Primary and Secondary ExpressRoute routers). This dashboard shows the Primary BGP session status is up for private peering and the Second BGP session status is down for private peering.
Note
During maintenance between the Microsoft edge and core network, BGP availability will appear down even if the BGP session between the customer edge and Microsoft edge remains up. For information about maintenance between the Microsoft edge and core network, make sure to have your maintenance alerts turned on and configured.
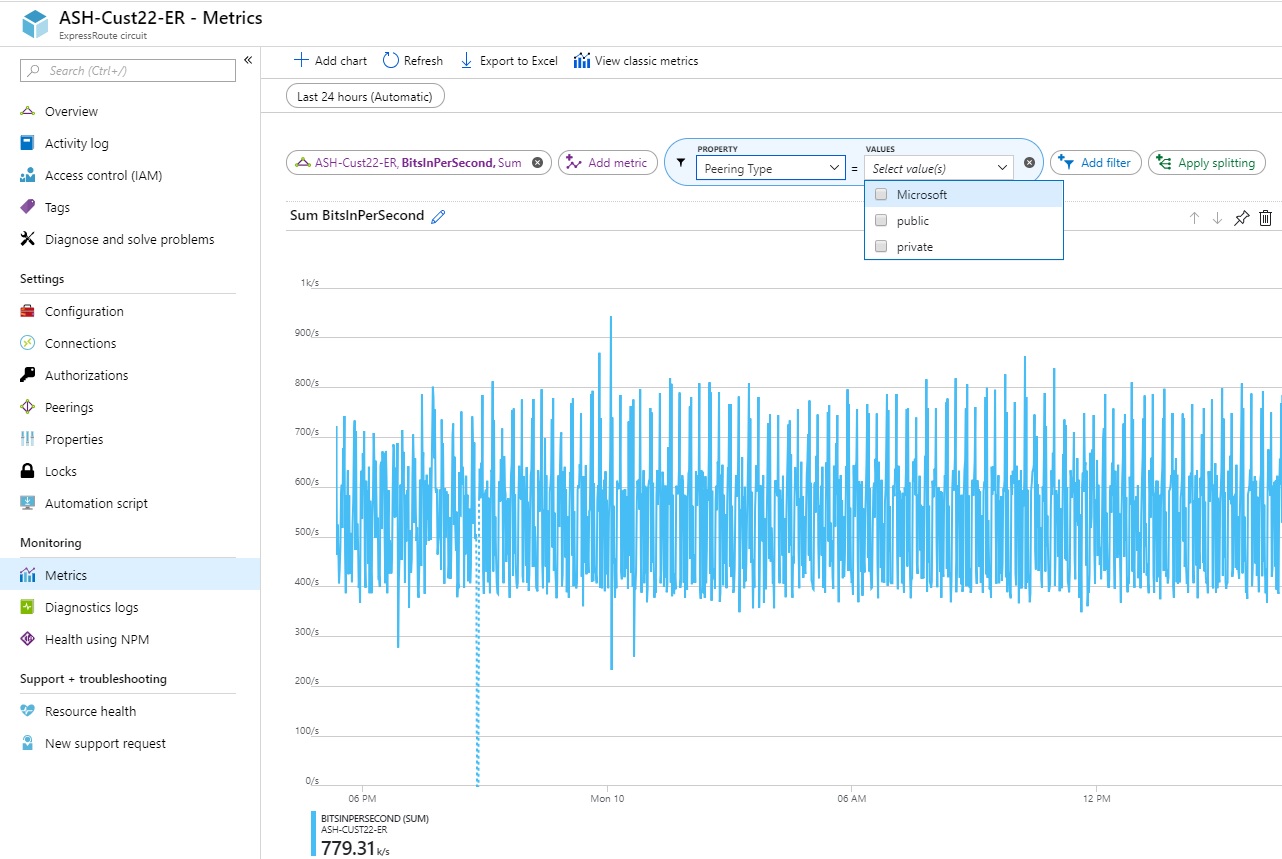
Bits In and Out - Metrics across all peerings
Aggregation type: Avg
You can view metrics across all peerings on a given ExpressRoute circuit.
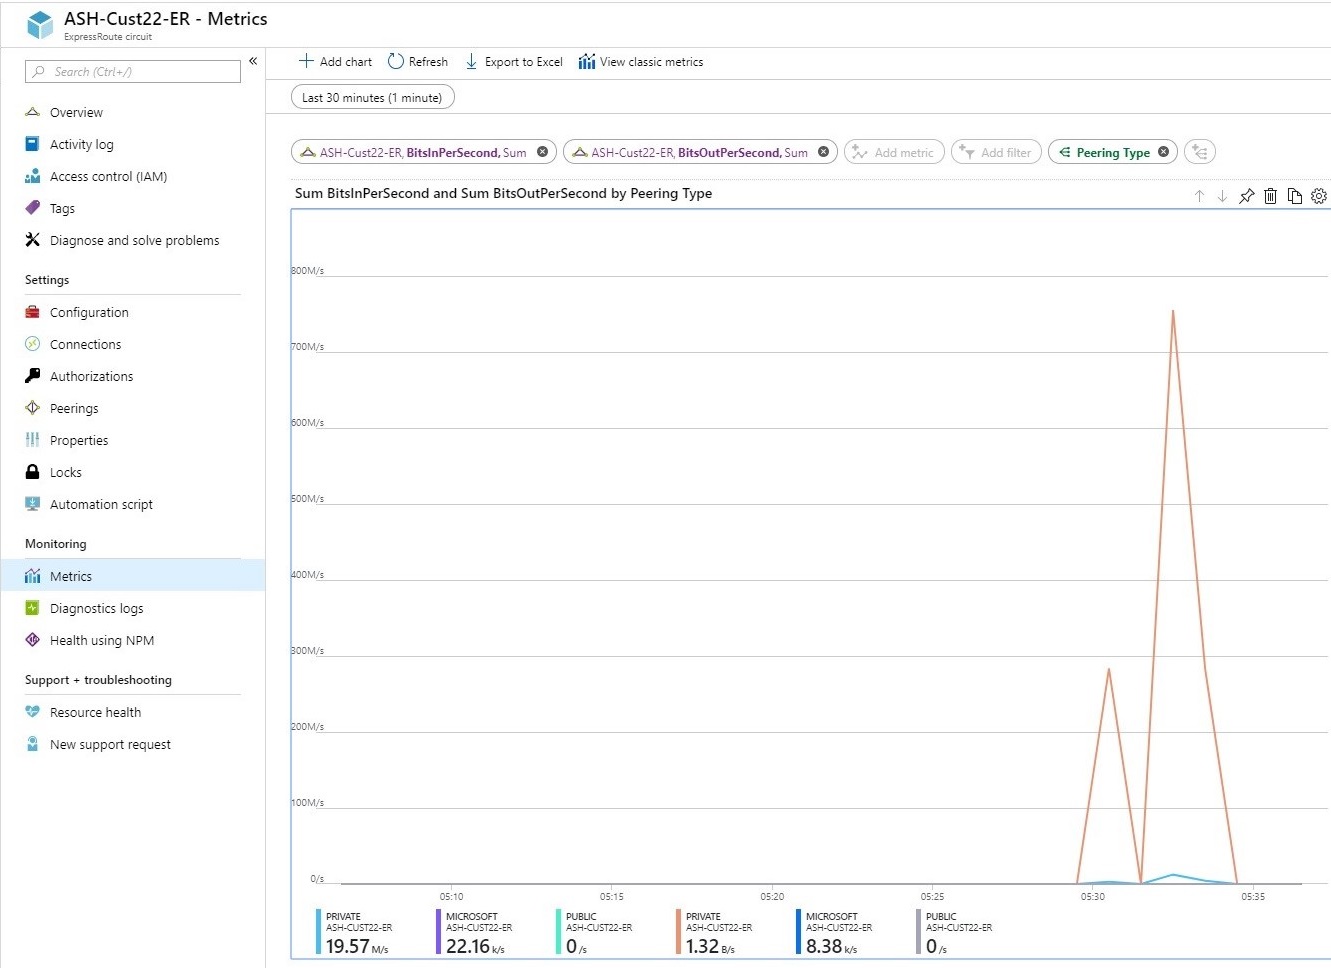
Bits In and Out - Metrics per peering
Aggregation type: Avg
You can view metrics for private, public, and Microsoft peering in bits/second.
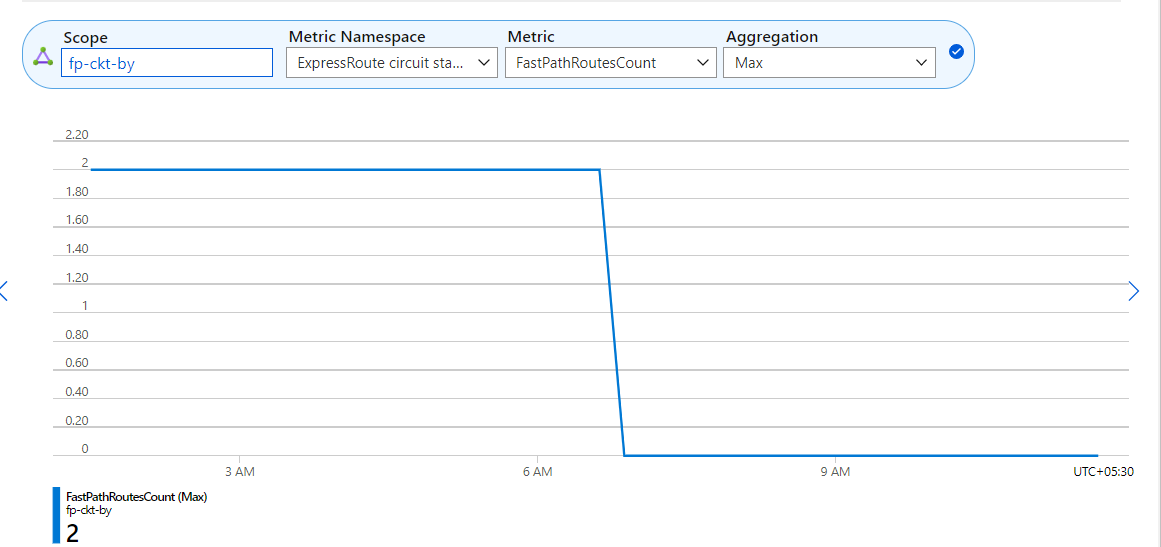
FastPath routes count (at circuit level)
Aggregation type: Max
This metric shows the number of FastPath routes configured on a circuit. Set an alert for when the number of FastPath routes on a circuit goes beyond the threshold limit. For more information, see ExpressRoute FastPath limits.
Virtual network gateway metrics
Aggregation type: Avg
When you deploy an ExpressRoute gateway, Azure manages the compute and functions of your gateway. There are six gateway metrics available to you to better understand the performance of your gateway:
- Bits received per second
- CPU Utilization
- Packets per seconds
- Count of routes advertised to peers
- Count of routes learned from peers
- Frequency of routes changed
- Number of VMs in the virtual network
- Active flows
- Max flows created per second
We highly recommended you set alerts for each of these metrics so that you're aware of when your gateway could be seeing performance issues.
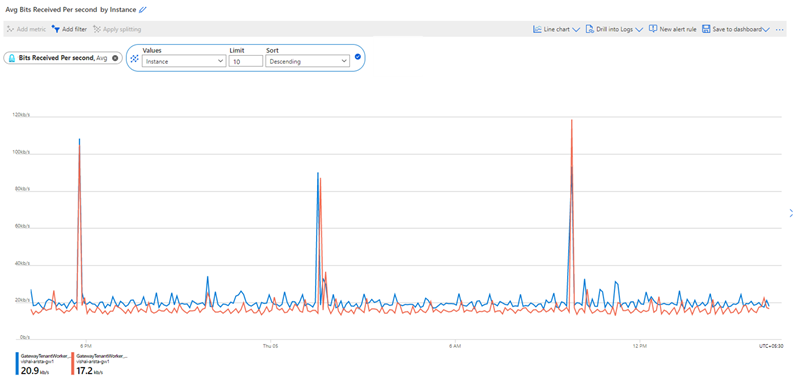
Bits received per second - Split by instance
Aggregation type: Avg
This metric captures inbound bandwidth utilization on the ExpressRoute virtual network gateway instances. Set an alert for how frequent the bandwidth utilization exceeds a certain threshold. If you need more bandwidth, increase the size of the ExpressRoute virtual network gateway.
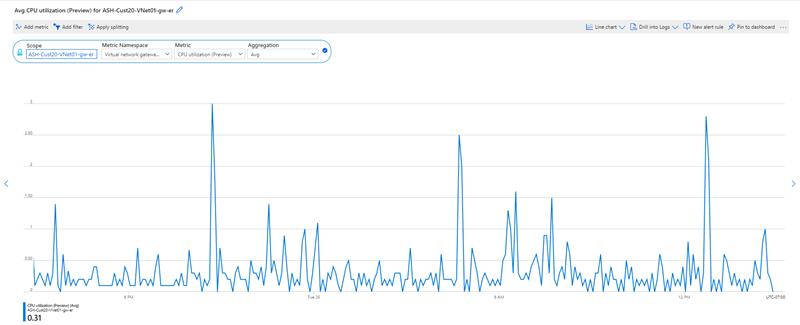
CPU Utilization - Split by instance
Aggregation type: Avg
You can view the CPU utilization of each gateway instance. The CPU utilization might spike briefly during routine host maintenance but prolong high CPU utilization could indicate your gateway is reaching a performance bottleneck. Increasing the size of the ExpressRoute gateway might resolve this issue. Set an alert for how frequent the CPU utilization exceeds a certain threshold.
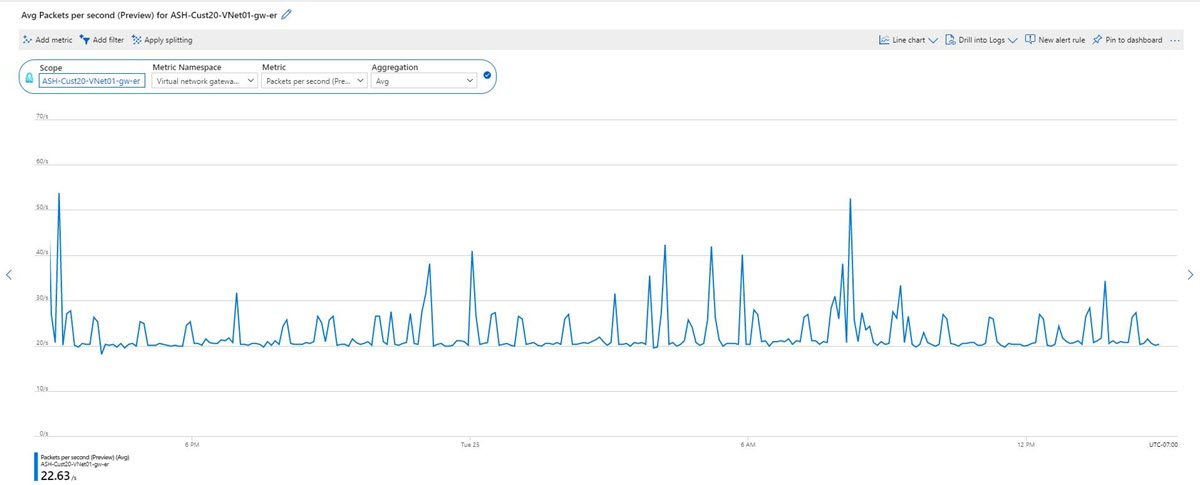
Packets Per Second - Split by instance
Aggregation type: Avg
This metric captures the number of inbound packets traversing the ExpressRoute gateway. You should expect to see a consistent stream of data here if your gateway is receiving traffic from your on-premises network. Set an alert for when the number of packets per second drops below a threshold indicating that your gateway is no longer receiving traffic.
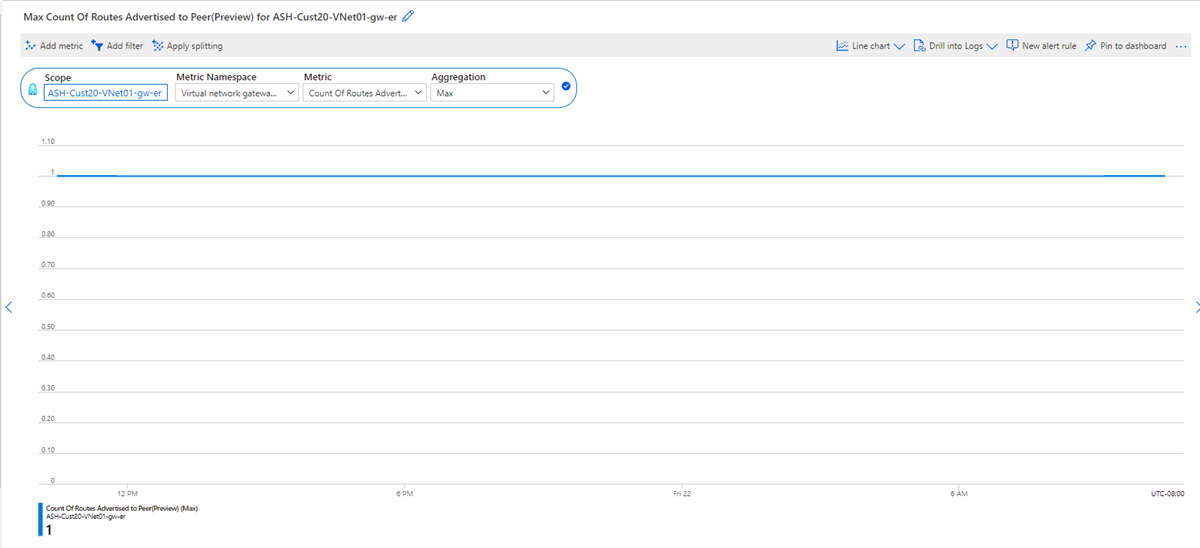
Count of Routes Advertised to Peer - Split by instance
Aggregation type: Max
This metric shows the number of routes the ExpressRoute gateway is advertising to the circuit. The address spaces might include virtual networks that are connected using virtual network peering and uses remote ExpressRoute gateway. You should expect the number of routes to remain consistent unless there are frequent changes to the virtual network address spaces. Set an alert for when the number of advertised routes drop below the threshold for the number of virtual network address spaces you're aware of.
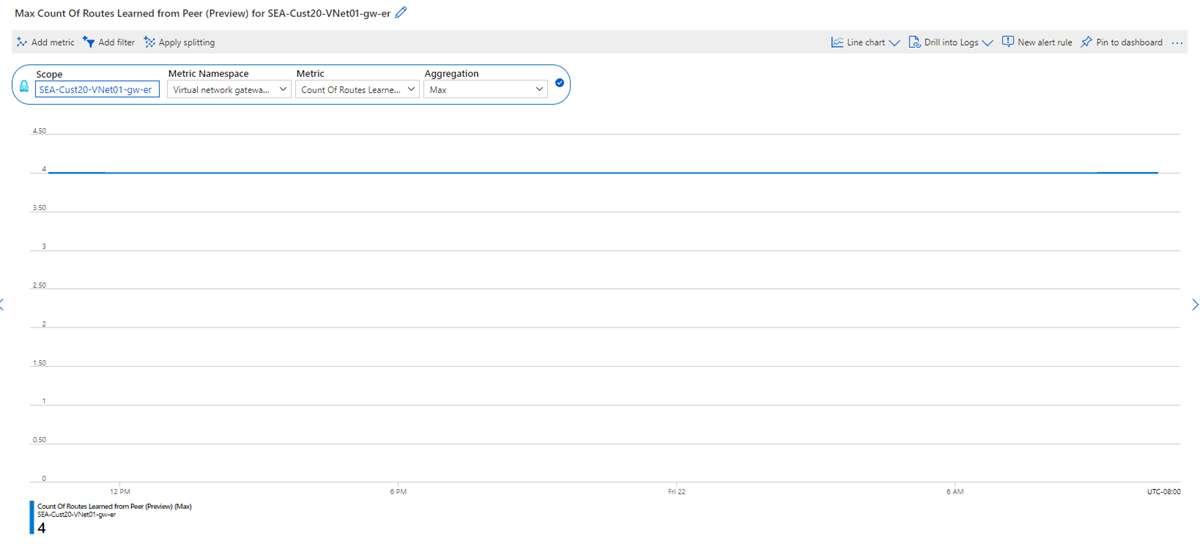
Count of routes learned from peer - Split by instance
Aggregation type: Max
This metric shows the number of routes the ExpressRoute gateway is learning from peers connected to the ExpressRoute circuit. These routes can be either from another virtual network connected to the same circuit or learned from on-premises. Set an alert for when the number of learned routes drop below a certain threshold. This metric can indicate either the gateway is seeing a performance problem or remote peers are no longer advertising routes to the ExpressRoute circuit.
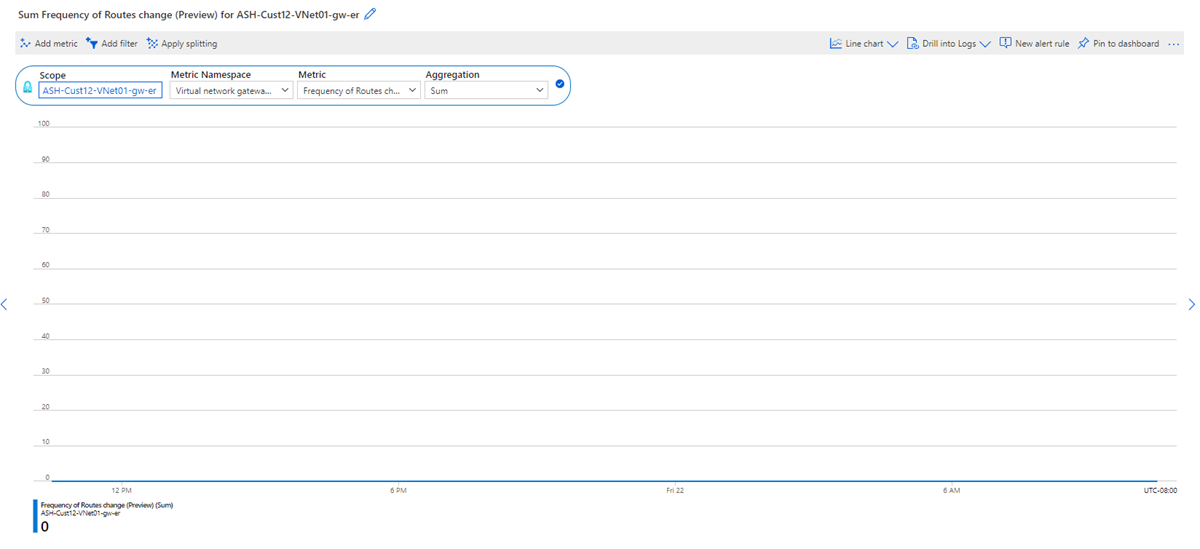
Frequency of routes change - Split by instance
Aggregation type: Sum
This metric shows the frequency of routes being learned from or advertised to remote peers. You should first investigate your on-premises devices to understand why the network is changing so frequently. A high frequency in routes change could indicate a performance problem on the ExpressRoute gateway where scaling the gateway SKU up might resolve the problem. Set an alert for a frequency threshold to be aware of when your ExpressRoute gateway is seeing abnormal route changes.
Number of VMs in the virtual network
Aggregation type: Max
This metric shows the number of virtual machines that are using the ExpressRoute gateway. The number of virtual machines might include VMs from peered virtual networks that use the same ExpressRoute gateway. Set an alert for this metric if the number of VMs goes above a certain threshold that could affect the gateway performance.
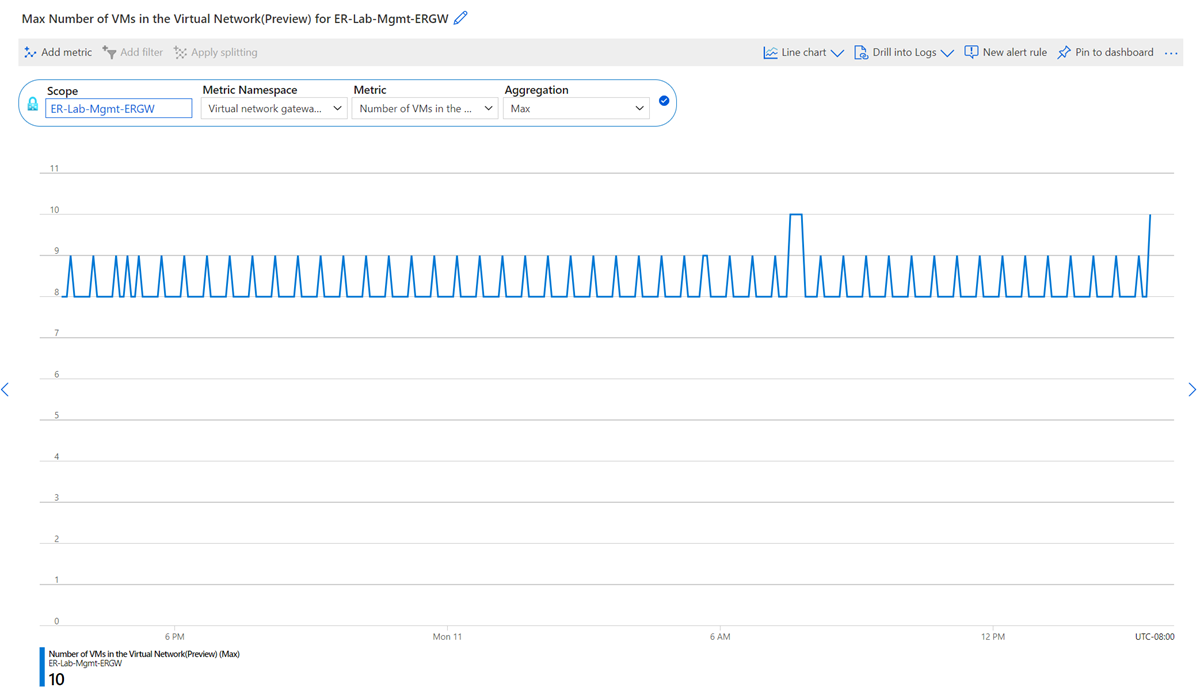
Note
To maintain reliability of the service, Microsoft often performs platform or OS maintenance on the gateway service. During this time, this metric may fluctuate and report inaccurately.
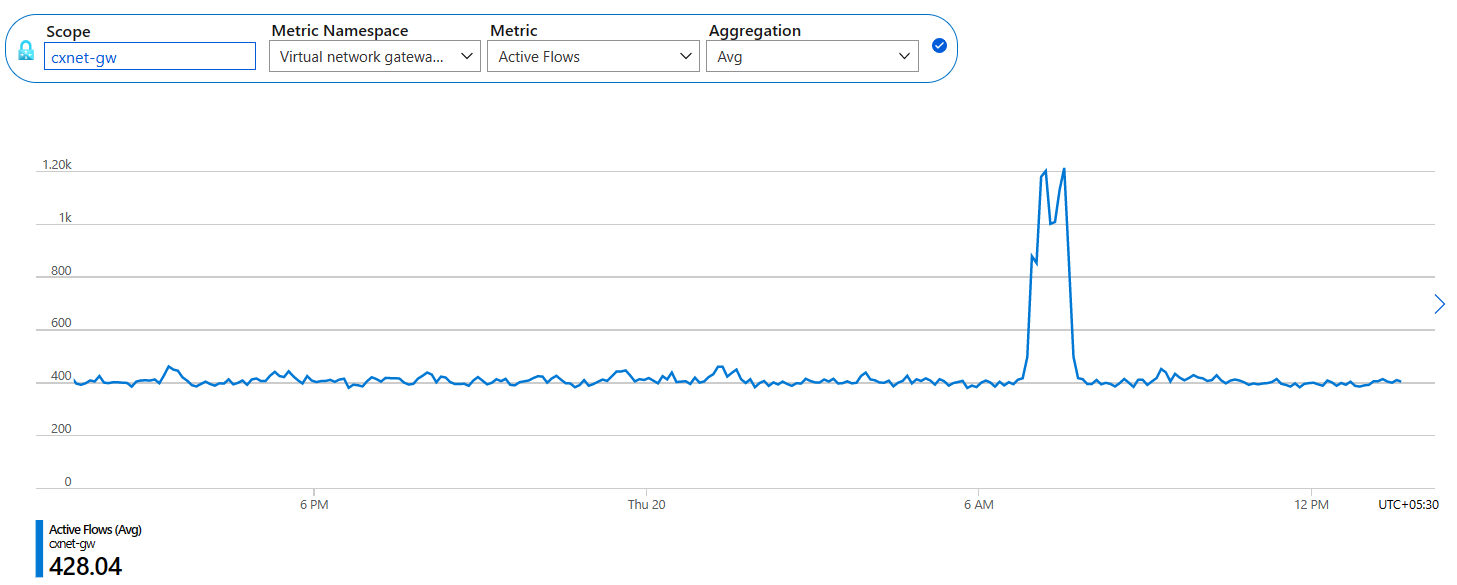
Active flows
Aggregation type: Avg
Split by: Gateway Instance
This metric displays a count of the total number of active flows on the ExpressRoute Gateway. Only inbound traffic from on-premises is captured for active flows. Through split at instance level, you can see active flow count per gateway instance. For more information, see understand network flow limits.
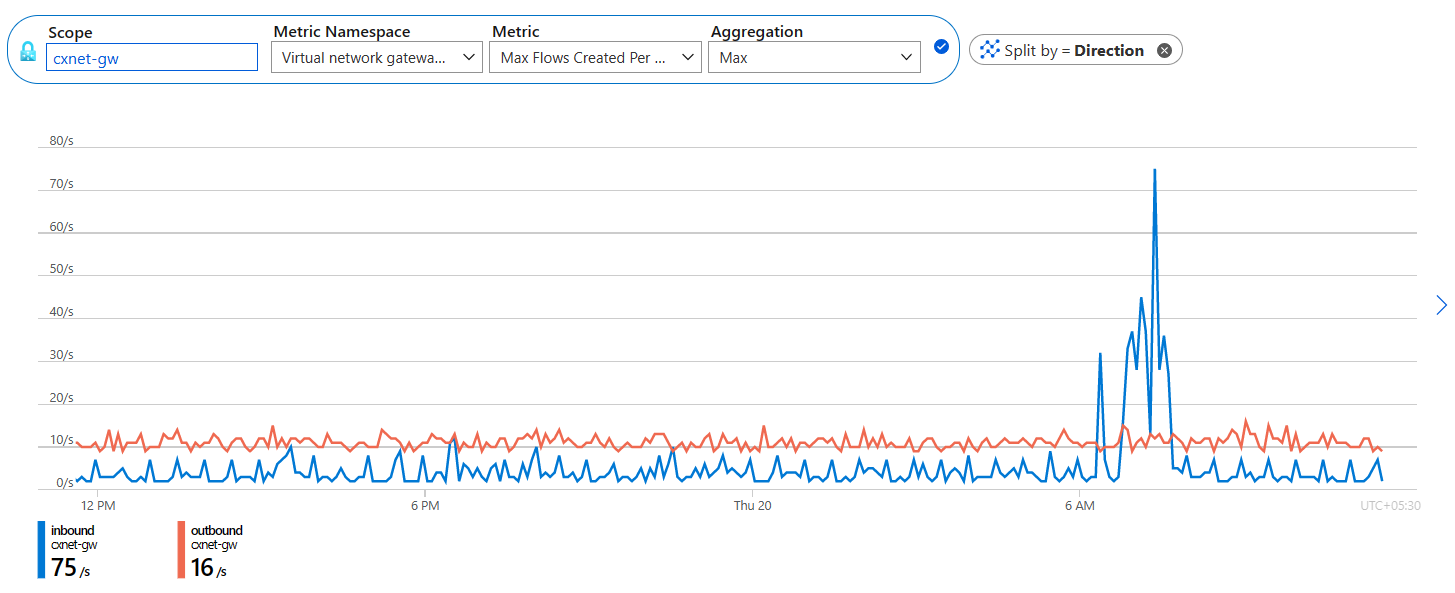
Max flows created per second
Aggregation type: Max
Split by: Gateway Instance and Direction (Inbound/Outbound)
This metric displays the maximum number of flows created per second on the ExpressRoute Gateway. Through split at instance level and direction, you can see max flow creation rate per gateway instance and inbound/outbound direction respectively. For more information, see understand network flow limits.
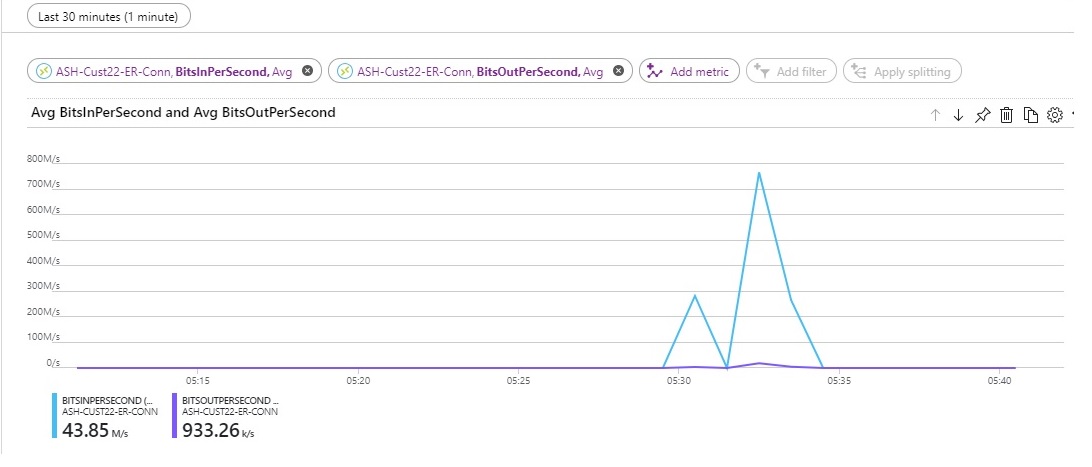
Gateway connections in bits/seconds
Aggregation type: Avg
This metric shows the bits per second for ingress and egress to Azure through the ExpressRoute gateway. You can split this metric further to see specific connections to the ExpressRoute circuit.
ExpressRoute Direct metrics
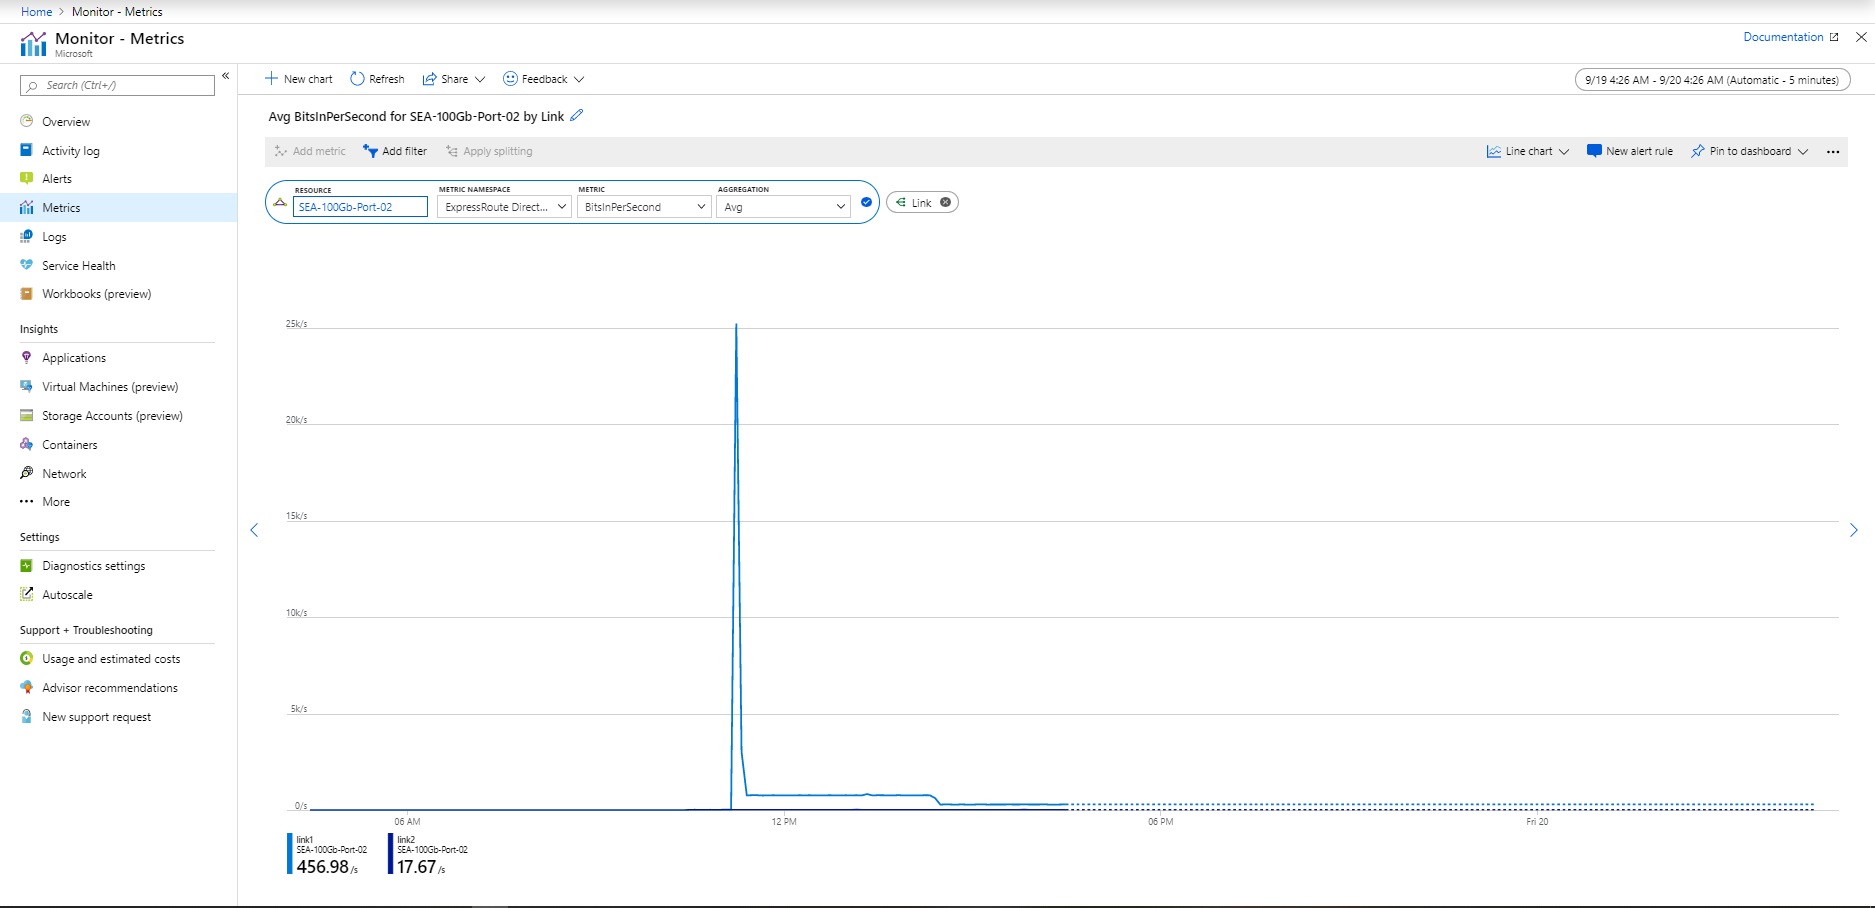
Bits In Per Second - Split by link
Aggregation type: Avg
You can view the bits in per second across both links of the ExpressRoute Direct port pair. Monitor this dashboard to compare inbound bandwidth for both links.
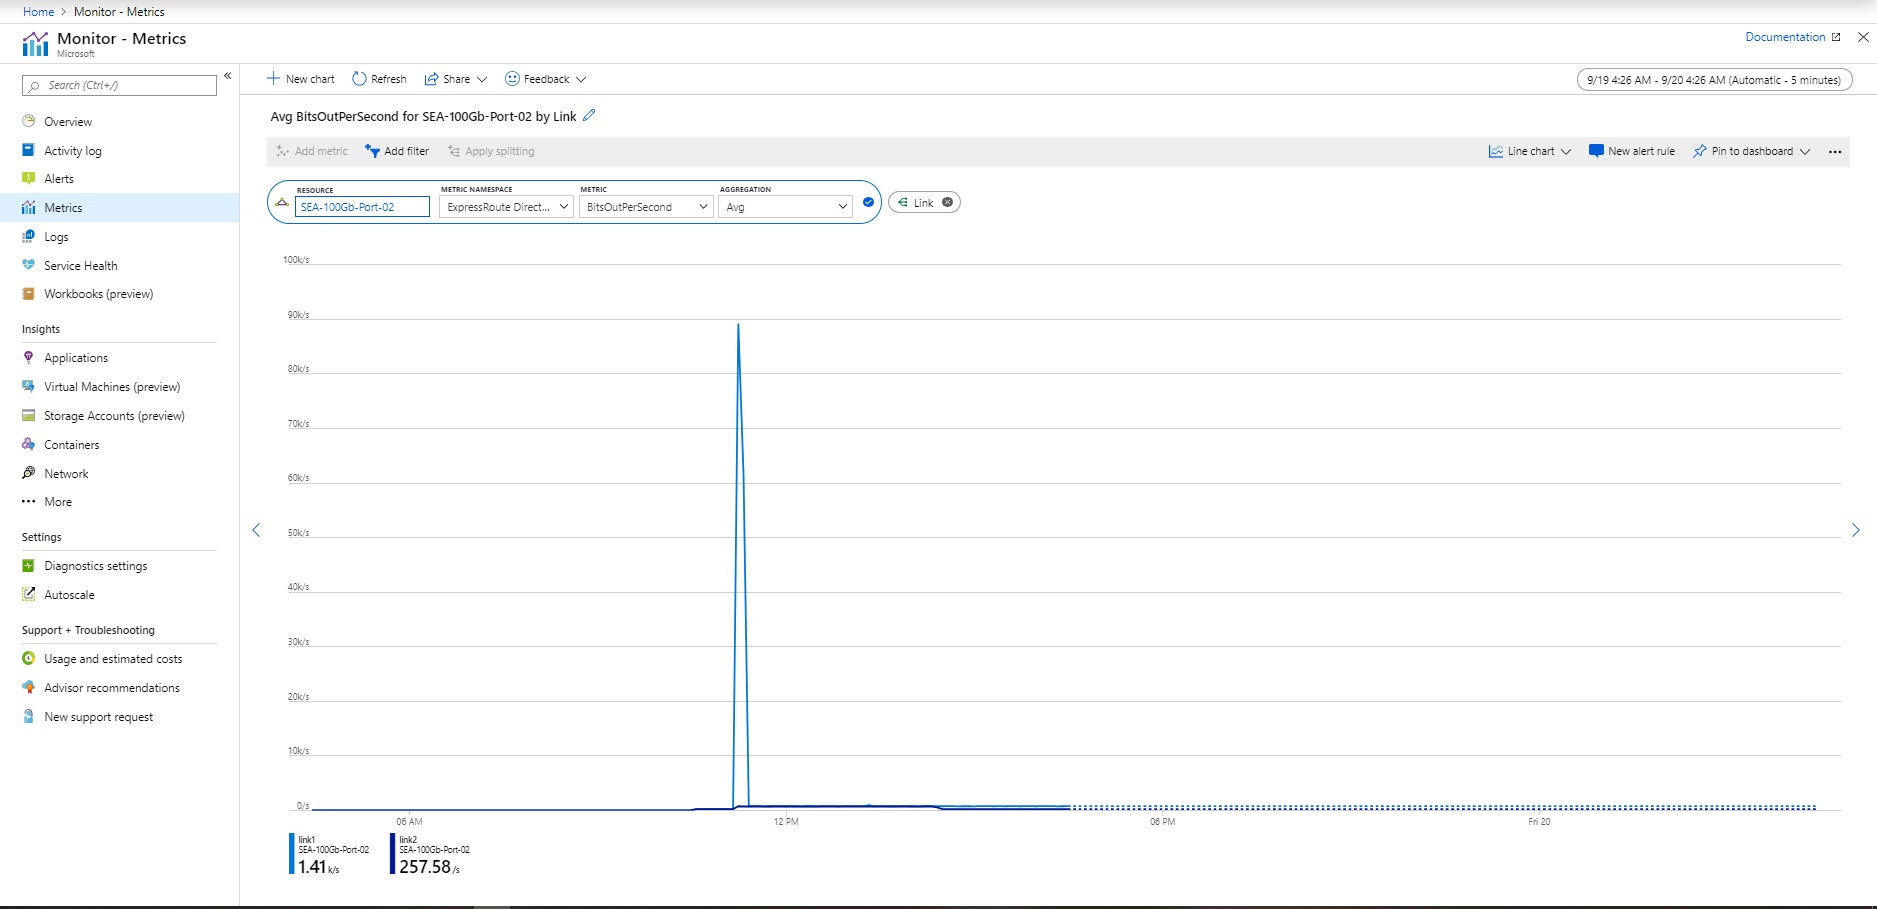
Bits Out Per Second - Split by link
Aggregation type: Avg
You can also view the bits out per second across both links of the ExpressRoute Direct port pair. Monitor this dashboard to compare outbound bandwidth for both links.
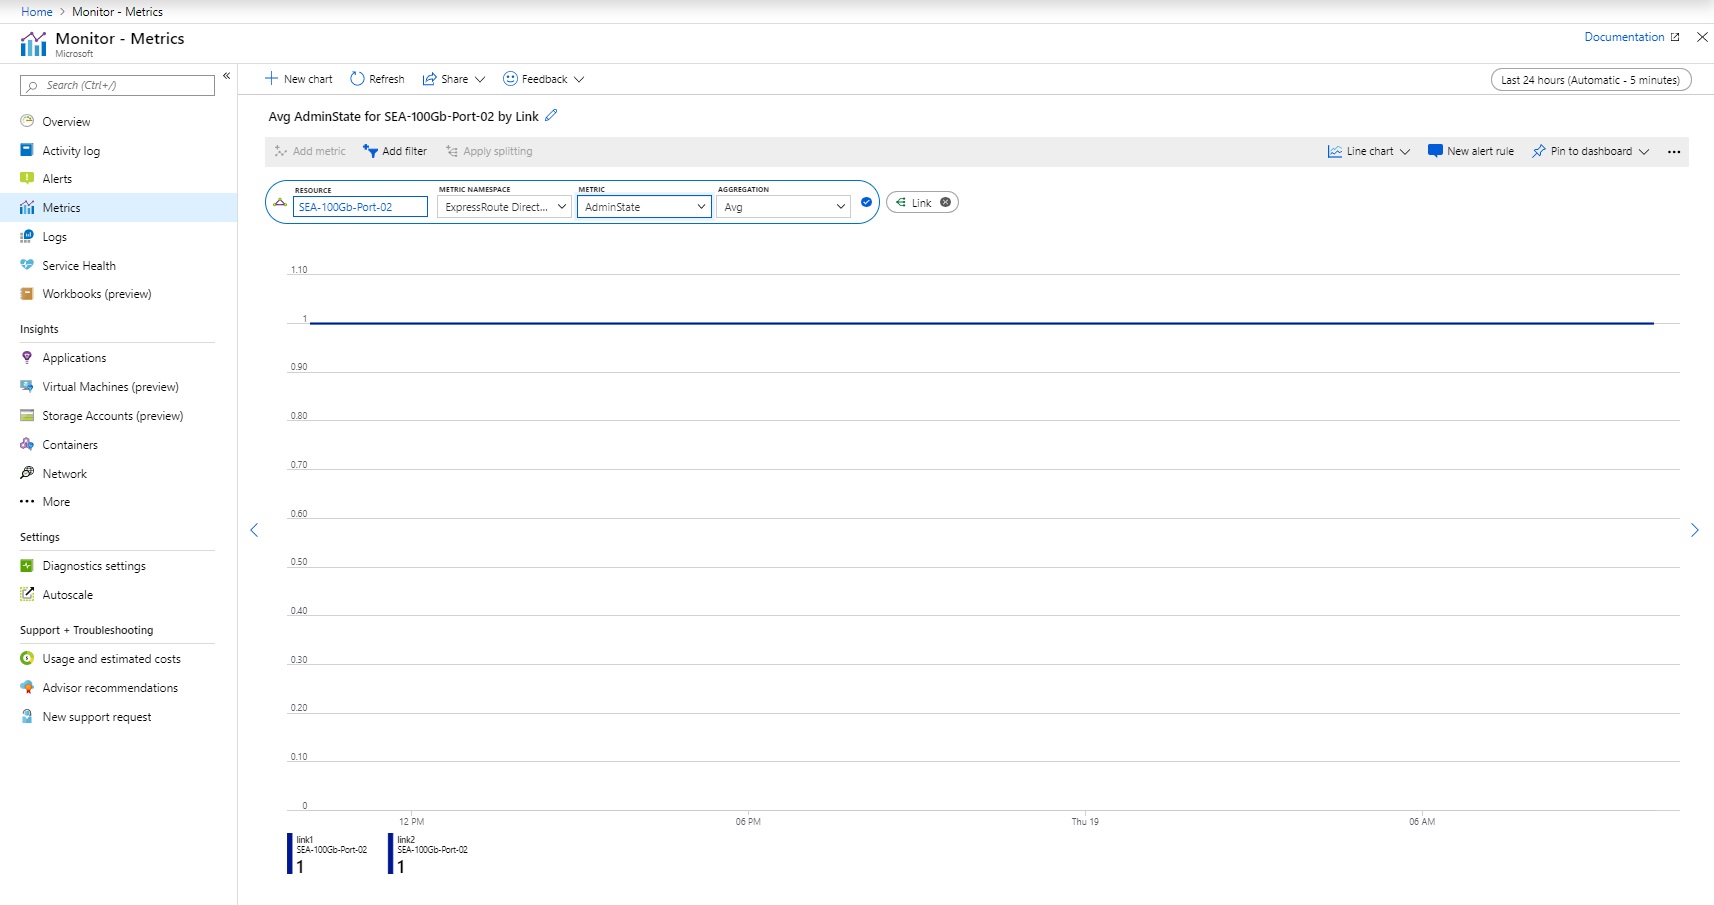
Admin State - Split by link
Aggregation type: Avg
You can view the Admin state for each link of the ExpressRoute Direct port pair. The Admin state represents if the physical port is on or off. This state is required to pass traffic across the ExpressRoute Direct connection.
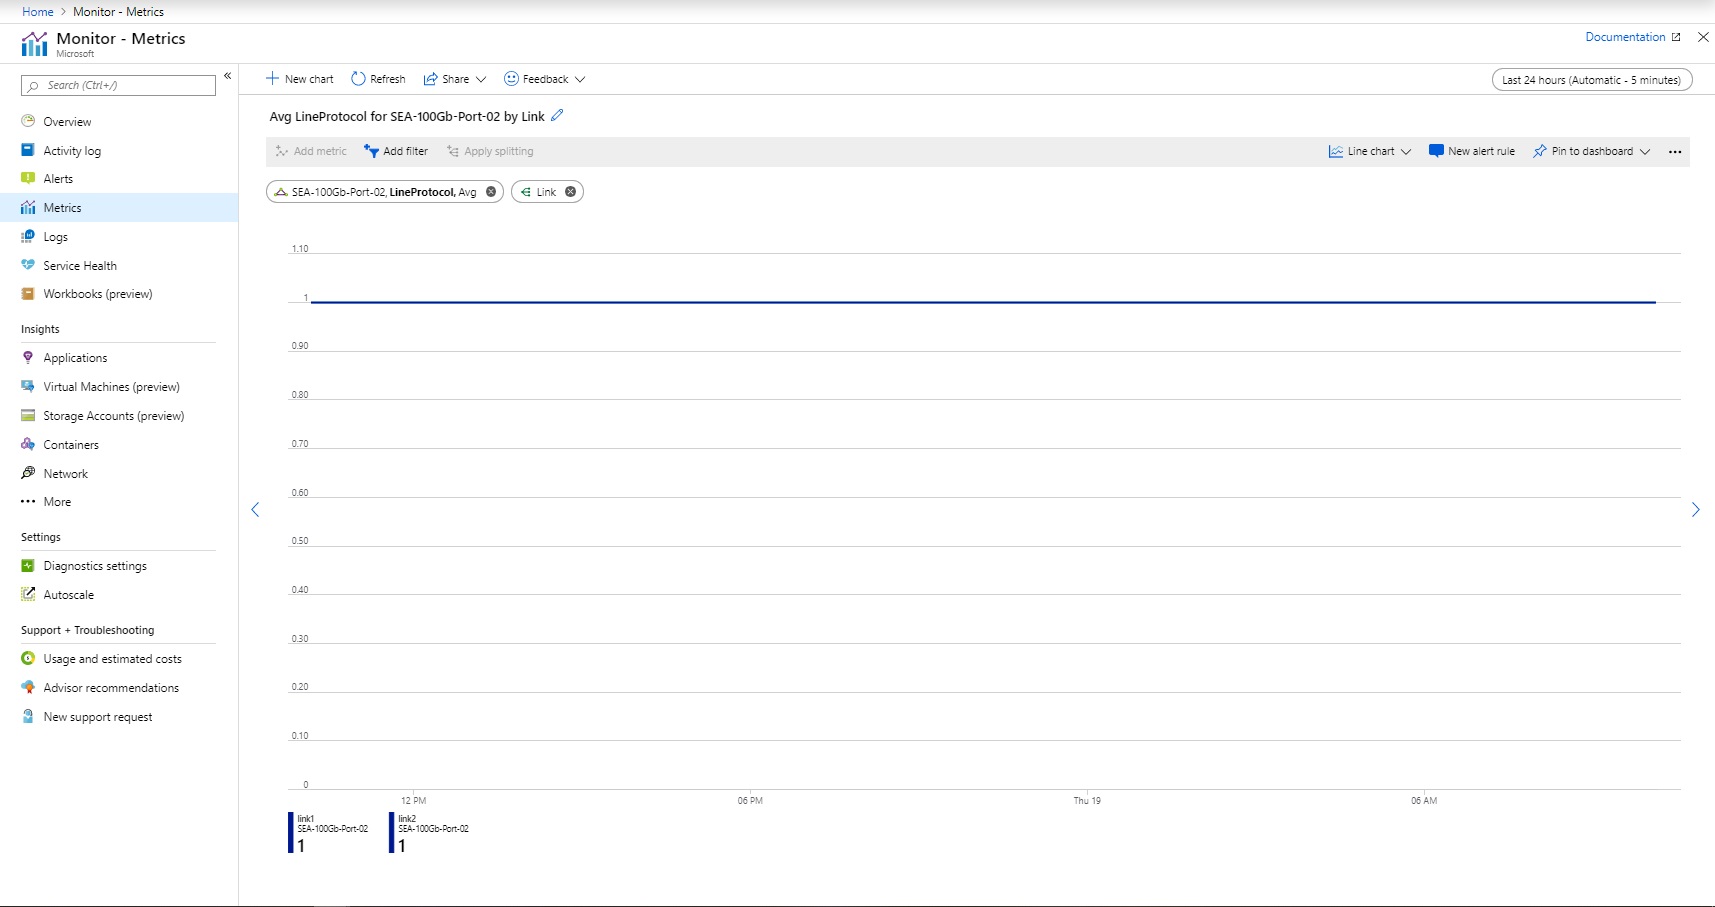
Line Protocol - Split by link
Aggregation type: Avg
You can view the line protocol across each link of the ExpressRoute Direct port pair. The Line Protocol indicates if the physical link is up and running over ExpressRoute Direct. Monitor this dashboard and set alerts to know when the physical connection goes down.
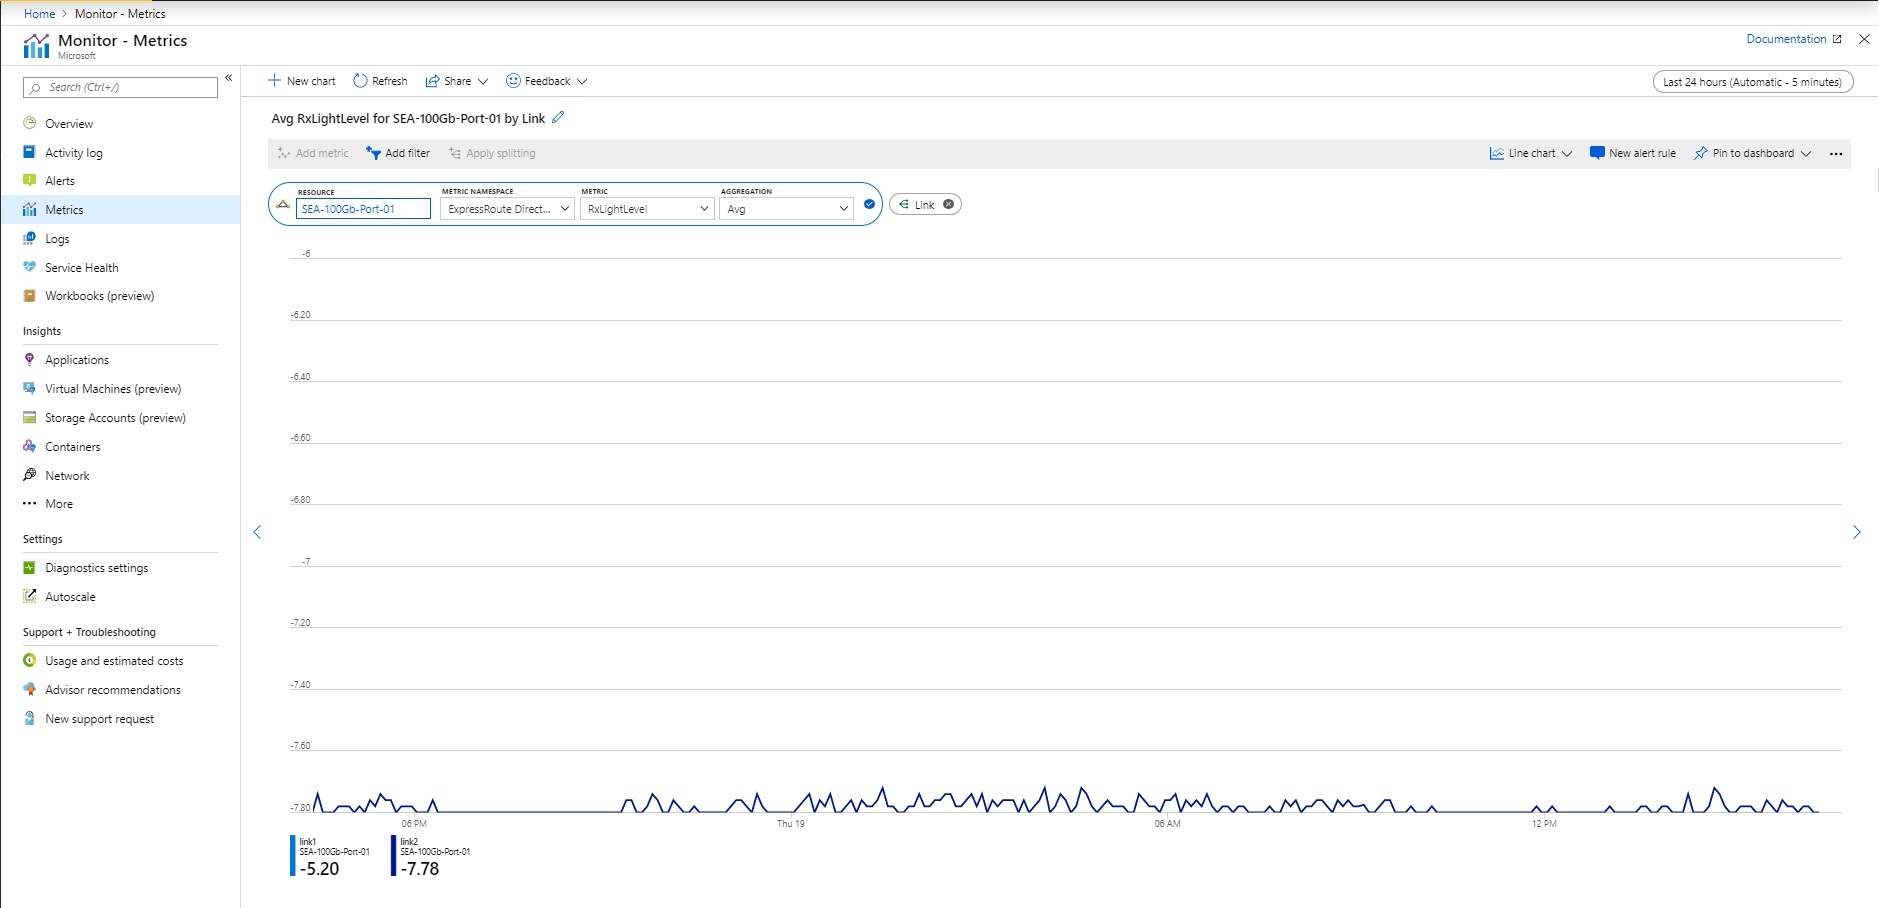
Rx Light Level - Split by link
Aggregation type: Avg
You can view the Rx light level (the light level that the ExpressRoute Direct port is receiving) for each port. Healthy Rx light levels generally fall within a range of -10 dBm to 0 dBm. Set alerts to be notified if the Rx light level falls outside of the healthy range.
Note
ExpressRoute Direct connectivity is hosted across different device platforms. Some ExpressRoute Direct connections will support a split view for Rx light levels by lane. However, this is not supported on all deployments.
Tx Light Level - Split by link
Aggregation type: Avg
You can view the Tx light level (the light level that the ExpressRoute Direct port is transmitting) for each port. Healthy Tx light levels generally fall within a range of -10 dBm to 0 dBm. Set alerts to be notified if the Tx light level falls outside of the healthy range.
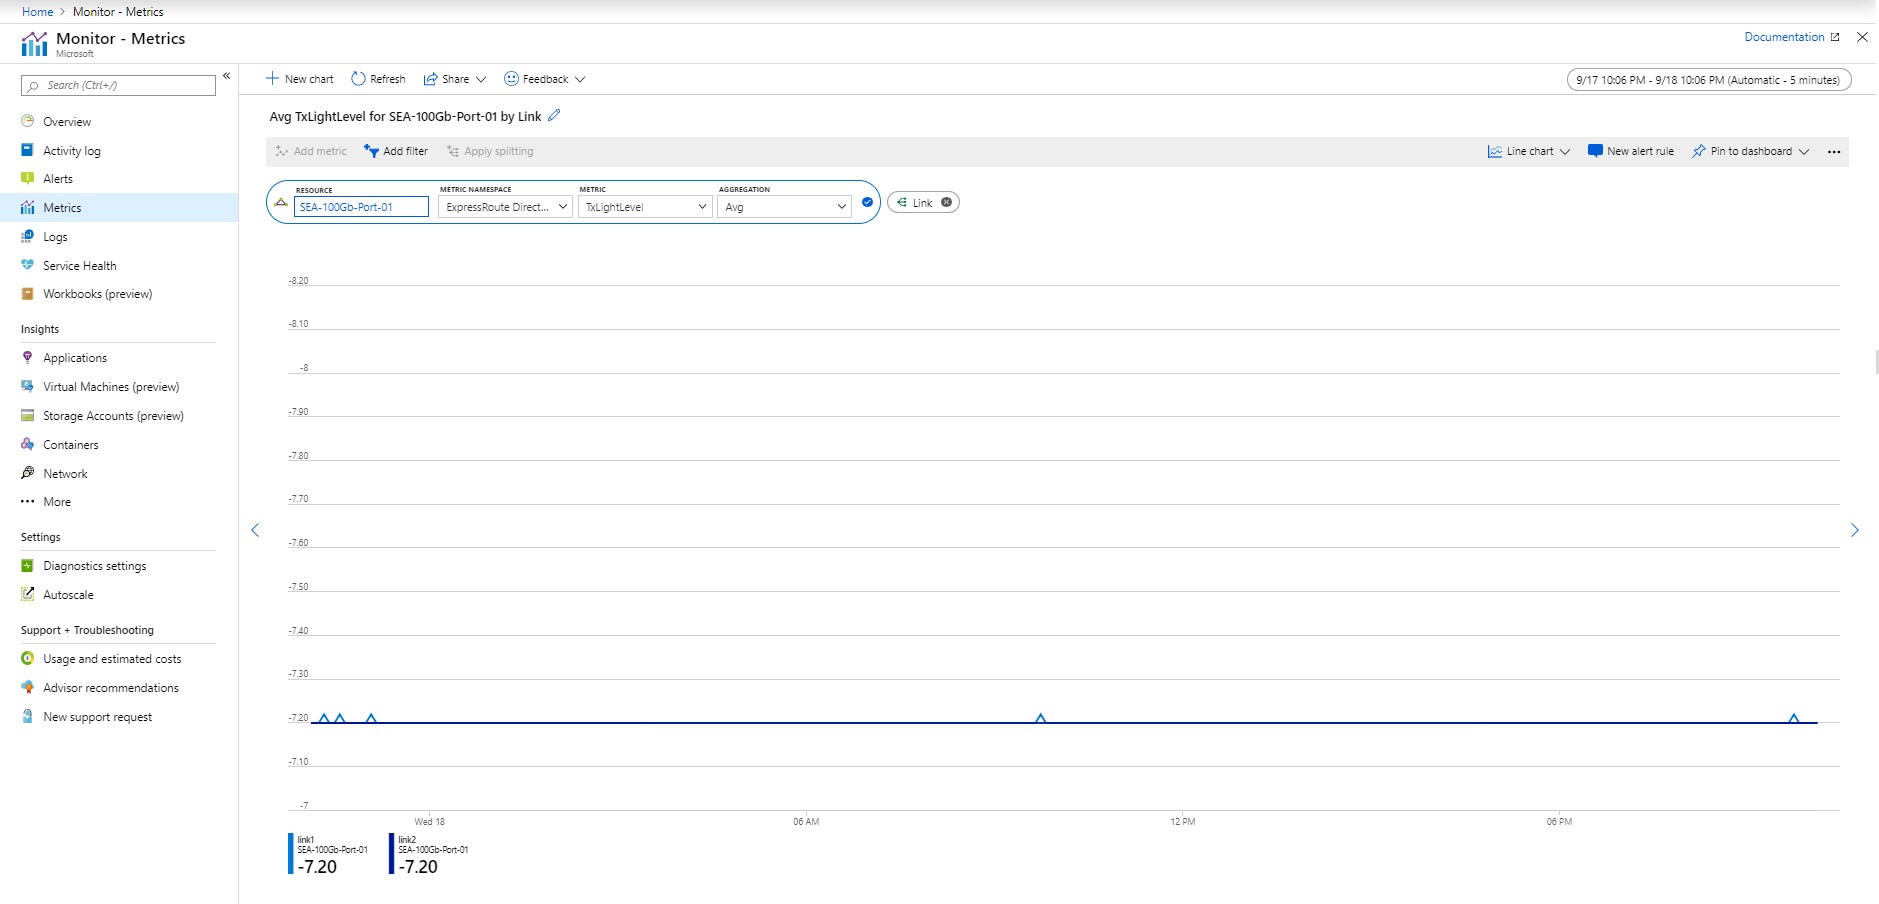
Note
ExpressRoute Direct connectivity is hosted across different device platforms. Some ExpressRoute Direct connections will support a split view for Tx light levels by lane. However, this is not supported on all deployments.
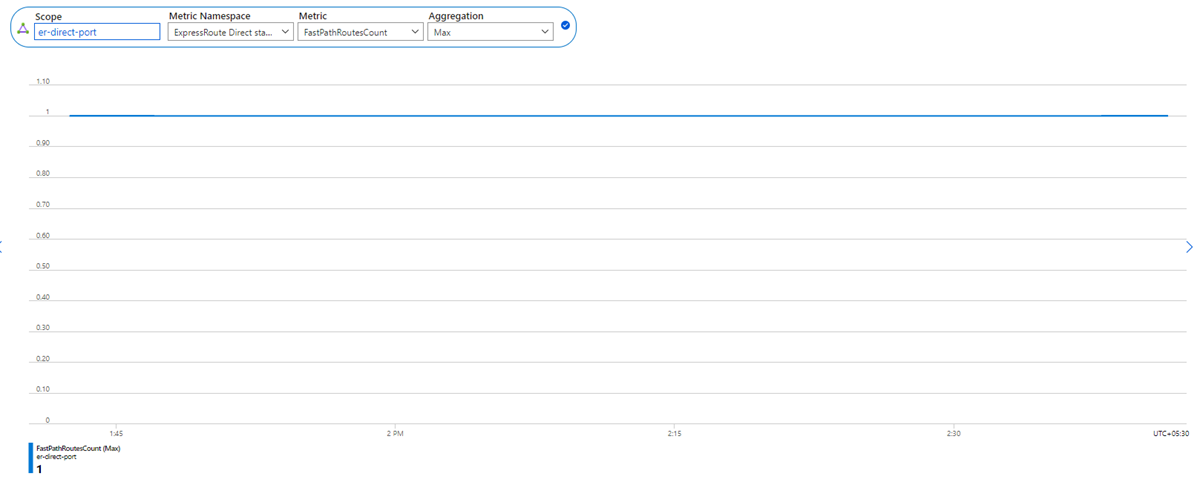
FastPath routes count (at port level)
Aggregation type: Max
This metric shows the number of FastPath routes configured on an ExpressRoute Direct port.
Guidance: Set an alert for when the number of FastPath routes on the port goes beyond the threshold limit. For more information, see ExpressRoute FastPath limits.
ExpressRoute Traffic Collector metrics
CPU Utilization - Split by instance
Aggregation type: Avg (of percentage of total utilized CPU)
Granularity: 5 min
You can view the CPU utilization of each ExpressRoute Traffic Collector instance. The CPU utilization might spike briefly during routine host maintenance, but prolonged high CPU utilization could indicate your ExpressRoute Traffic Collector is reaching a performance bottleneck.
Guidance: Set an alert for when avg CPU utilization exceeds a certain threshold.

Memory Utilization - Split by instance
Aggregation type: Avg (of percentage of total utilized Memory)
Granularity: 5 min
You can view the memory utilization of each ExpressRoute Traffic Collector instance. Memory utilization might spike briefly during routine host maintenance, but prolonged high memory utilization could indicate your Azure Traffic Collector is reaching a performance bottleneck.
Guidance: Set an alert for when avg memory utilization exceeds a certain threshold.

Count of flow records processed - Split by instances or ExpressRoute circuit
Aggregation type: Count
Granularity: 5 min
You can view the count of number of flow records processed by ExpressRoute Traffic Collector, aggregated across ExpressRoute Circuits. Customer can split the metrics across each ExpressRoute Traffic Collector instance or ExpressRoute circuit when multiple circuits are associated to the ExpressRoute Traffic Collector. Monitoring this metric helps you understand if you need to deploy more ExpressRoute Traffic Collector instances or migrate ExpressRoute circuit association from one ExpressRoute Traffic Collector deployment to another.
Guidance: Splitting by circuits is recommended when multiple ExpressRoute circuits are associated with an ExpressRoute Traffic Collector deployment. This metric helps determine the flow count of each ExpressRoute circuit and ExpressRoute Traffic Collector utilization by each ExpressRoute circuit.

Metric dimensions
For information about what metric dimensions are, see Multi-dimensional metrics.
This service has the following dimensions associated with its metrics.
Dimension for ExpressRoute circuit:
| Dimension Name | Description |
|---|---|
| PeeringType | The type of peering configured. The supported values are Microsoft and Private peering. |
| Peering | The supported values are Primary and Secondary. |
| DeviceRole | |
| PeeredCircuitSkey | The remote ExpressRoute circuit service key connected using Global Reach. |
Dimension for ExpressRoute gateway:
| Dimension Name | Description |
|---|---|
| BgpPeerAddress | |
| ConnectionName | |
| direction | |
| roleInstance | The gateway instance. Each ExpressRoute gateway is composed of multiple instances. The supported values are GatewayTenantWork_IN_X, where X is a minimum of 0 and a maximum of the number of gateway instances -1. |
Dimension for Express Direct:
| Dimension Name | Description |
|---|---|
| Lane | |
| Link | The physical link. Each ExpressRoute Direct port pair is composed of two physical links for redundancy, and the supported values are link1 and link2. |
Resource logs
This section lists the types of resource logs you can collect for this service. The section pulls from the list of all resource logs category types supported in Azure Monitor.
Supported resource logs for Microsoft.Network/expressRouteCircuits
| Category | Category display name | Log table | Supports basic log plan | Supports ingestion-time transformation | Example queries | Costs to export |
|---|---|---|---|---|---|---|
PeeringRouteLog |
Peering Route Table Logs | AzureDiagnostics Logs from multiple Azure resources. |
No | No | Queries | No |
Azure Monitor Logs tables
This section lists the Azure Monitor Logs tables relevant to this service, which are available for query by Log Analytics using Kusto queries. The tables contain resource log data and possibly more depending on what is collected and routed to them.
ExpressRoute Microsoft.Network/expressRouteCircuits
Activity log
The linked table lists the operations that can be recorded in the activity log for this service. These operations are a subset of all the possible resource provider operations in the activity log.
For more information on the schema of activity log entries, see Activity Log schema.
The following table lists the operations related to ExpressRoute that might be created in the Activity log.
| Operation | Description |
|---|---|
| All Administrative operations | All administrative operations including create, update, and delete of an ExpressRoute circuit. |
| Create or update ExpressRoute circuit | An ExpressRoute circuit was created or updated. |
| Deletes ExpressRoute circuit | An ExpressRoute circuit was deleted. |
For more information on the schema of Activity Log entries, see Activity Log schema.
Schemas
For detailed description of the top-level diagnostic logs schema, see Supported services, schemas, and categories for Azure Diagnostic Logs.
When you review any metrics through Log Analytics, the output contains the following columns:
| Column | Type | Description |
|---|---|---|
| TimeGrain | string | PT1M (metric values are pushed every minute) |
| Count | real | Usually equal to 2 (each MSEE pushes a single metric value every minute) |
| Minimum | real | The minimum of the two metric values pushed by the two MSEEs |
| Maximum | real | The maximum of the two metric values pushed by the two MSEEs |
| Average | real | Equal to (Minimum + Maximum)/2 |
| Total | real | Sum of the two metric values from both MSEEs (the main value to focus on for the metric queried) |
Related content
- See Monitor Azure ExpressRoute for a description of monitoring ExpressRoute.
- See Monitor Azure resources with Azure Monitor for details on monitoring Azure resources.
Feedback
În curând: Pe parcursul anului 2024, vom elimina treptat Probleme legate de GitHub ca mecanism de feedback pentru conținut și îl vom înlocui cu un nou sistem de feedback. Pentru mai multe informații, consultați: https://aka.ms/ContentUserFeedback.
Trimiteți și vizualizați feedback pentru