Monitor Azure ExpressRoute
This article describes:
- The types of monitoring data you can collect for this service.
- Ways to analyze that data.
Note
If you're already familiar with this service and/or Azure Monitor and just want to know how to analyze monitoring data, see the Analyze section near the end of this article.
When you have critical applications and business processes that rely on Azure resources, you need to monitor and get alerts for your system. The Azure Monitor service collects and aggregates metrics and logs from every component of your system. Azure Monitor provides you with a view of availability, performance, and resilience, and notifies you of issues. You can use the Azure portal, PowerShell, Azure CLI, REST API, or client libraries to set up and view monitoring data.
- For more information on Azure Monitor, see the Azure Monitor overview.
- For more information on how to monitor Azure resources in general, see Monitor Azure resources with Azure Monitor.
Insights
Some services in Azure have a built-in monitoring dashboard in the Azure portal that provides a starting point for monitoring your service. These dashboards are called insights, and you can find them in the Insights Hub of Azure Monitor in the Azure portal.
ExpressRoute uses Network insights to provide a detailed topology mapping of all ExpressRoute components (peerings, connections, gateways) in relation with one another. Network insights for ExpressRoute also have preloaded metrics dashboard for availability, throughput, packet drops, and gateway metrics. For more information, see Azure ExpressRoute Insights using Networking Insights.
Resource types
Azure uses the concept of resource types and IDs to identify everything in a subscription. Azure Monitor similarly organizes core monitoring data into metrics and logs based on resource types, also called namespaces. Different metrics and logs are available for different resource types. Your service might be associated with more than one resource type.
Resource types are also part of the resource IDs for every resource running in Azure. For example, one resource type for a virtual machine is Microsoft.Compute/virtualMachines. For a list of services and their associated resource types, see Resource providers.
For more information about the resource types for ExpressRoute, see Azure ExpressRoute monitoring data reference.
Data storage
For Azure Monitor:
- Metrics data is stored in the Azure Monitor metrics database.
- Log data is stored in the Azure Monitor logs store. Log Analytics is a tool in the Azure portal that can query this store.
- The Azure activity log is a separate store with its own interface in the Azure portal.
You can optionally route metric and activity log data to the Azure Monitor logs store. You can then use Log Analytics to query the data and correlate it with other log data.
Many services can use diagnostic settings to send metric and log data to other storage locations outside Azure Monitor. Examples include Azure Storage, hosted partner systems, and non-Azure partner systems, by using Event Hubs.
For detailed information on how Azure Monitor stores data, see Azure Monitor data platform.
Resource Logs aren't collected and stored until you create a diagnostic setting and route them to one or more locations.
See Create diagnostic setting to collect platform logs and metrics in Azure for the detailed process for creating a diagnostic setting using the Azure portal, CLI, or PowerShell. When you create a diagnostic setting, you specify which categories of logs to collect. The categories for Azure ExpressRoute are listed in Azure ExpressRoute monitoring data reference.
Important
Enabling these settings requires additional Azure services (storage account, event hub, or Log Analytics), which may increase your cost. To calculate an estimated cost, visit the Azure pricing calculator.
Azure Monitor platform metrics
Azure Monitor provides platform metrics for most services. These metrics are:
- Individually defined for each namespace.
- Stored in the Azure Monitor time-series metrics database.
- Lightweight and capable of supporting near real-time alerting.
- Used to track the performance of a resource over time.
Collection: Azure Monitor collects platform metrics automatically. No configuration is required.
Routing: You can also usually route platform metrics to Azure Monitor Logs / Log Analytics so you can query them with other log data. For more information, see the Metrics diagnostic setting. For how to configure diagnostic settings for a service, see Create diagnostic settings in Azure Monitor.
For a list of all metrics it's possible to gather for all resources in Azure Monitor, see Supported metrics in Azure Monitor.
For a list of available metrics for ExpressRoute, see Azure ExpressRoute monitoring data reference.
Note
Using Classic Metrics is not recommended.
Analyzing metrics
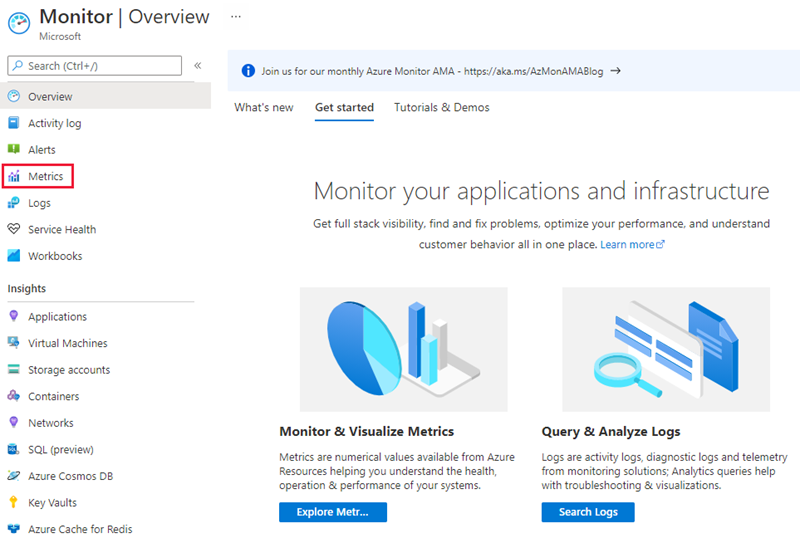
You can analyze metrics for Azure ExpressRoute with metrics from other Azure services using metrics explorer by opening Metrics from the Azure Monitor menu. See Analyze metrics with Azure Monitor metrics explorer for details on using this tool.
For reference, you can see a list of all resource metrics supported in Azure Monitor.
- To view ExpressRoute metrics, filter by Resource Type ExpressRoute circuits.
- To view Global Reach metrics, filter by Resource Type ExpressRoute circuits and select an ExpressRoute circuit resource that has Global Reach enabled.
- To view ExpressRoute Direct metrics, filter Resource Type by ExpressRoute Ports.
Once a metric is selected, the default aggregation is applied. Optionally, you can apply splitting, which shows the metric with different dimensions.
ExpressRoute metrics
To view Metrics, go to the Azure Monitor page and select Metrics. To view ExpressRoute metrics, filter by Resource Type ExpressRoute circuits. To view Global Reach metrics, filter by Resource Type ExpressRoute circuits and select an ExpressRoute circuit resource that has Global Reach enabled. To view ExpressRoute Direct metrics, filter Resource Type by ExpressRoute Ports.
After a metric is selected, the default aggregation is applied. Optionally, you can apply splitting, which shows the metric with different dimensions.
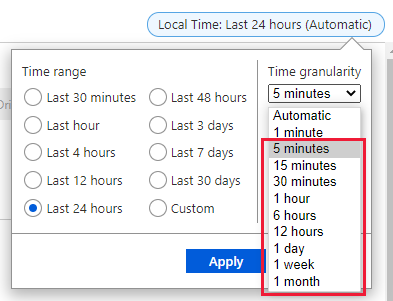
Important
When viewing ExpressRoute metrics in the Azure portal, select a time granularity of 5 minutes or greater for best possible results.
For the ExpressRoute metrics, see Azure ExpressRoute monitoring data reference.
Aggregation Types
Metrics explorer supports sum, maximum, minimum, average and count as aggregation types. You should use the recommended Aggregation type when reviewing the insights for each ExpressRoute metric.
- Sum: The sum of all values captured during the aggregation interval.
- Count: The number of measurements captured during the aggregation interval.
- Average: The average of the metric values captured during the aggregation interval.
- Min: The smallest value captured during the aggregation interval.
- Max: The largest value captured during the aggregation interval.
Azure Monitor resource logs
Resource logs provide insight into operations that were done by an Azure resource. Logs are generated automatically, but you must route them to Azure Monitor logs to save or query them. Logs are organized in categories. A given namespace might have multiple resource log categories.
Collection: Resource logs aren't collected and stored until you create a diagnostic setting and route the logs to one or more locations. When you create a diagnostic setting, you specify which categories of logs to collect. There are multiple ways to create and maintain diagnostic settings, including the Azure portal, programmatically, and though Azure Policy.
Routing: The suggested default is to route resource logs to Azure Monitor Logs so you can query them with other log data. Other locations such as Azure Storage, Azure Event Hubs, and certain Microsoft monitoring partners are also available. For more information, see Azure resource logs and Resource log destinations.
For detailed information about collecting, storing, and routing resource logs, see Diagnostic settings in Azure Monitor.
For a list of all available resource log categories in Azure Monitor, see Supported resource logs in Azure Monitor.
All resource logs in Azure Monitor have the same header fields, followed by service-specific fields. The common schema is outlined in Azure Monitor resource log schema.
For the available resource log categories, their associated Log Analytics tables, and the log schemas for ExpressRoute, see Azure ExpressRoute monitoring data reference.
Azure activity log
The activity log contains subscription-level events that track operations for each Azure resource as seen from outside that resource; for example, creating a new resource or starting a virtual machine.
Collection: Activity log events are automatically generated and collected in a separate store for viewing in the Azure portal.
Routing: You can send activity log data to Azure Monitor Logs so you can analyze it alongside other log data. Other locations such as Azure Storage, Azure Event Hubs, and certain Microsoft monitoring partners are also available. For more information on how to route the activity log, see Overview of the Azure activity log.
More metrics in Log Analytics
You can also view ExpressRoute metrics by going to your ExpressRoute circuit resource and selecting the Logs tab. For any metrics you query, the output contains the following columns.
| Column | Type | Description |
|---|---|---|
| TimeGrain | string | PT1M (metric values are pushed every minute) |
| Count | real | Usually is 2 (each MSEE pushes a single metric value every minute) |
| Minimum | real | The minimum of the two metric values pushed by the two MSEEs |
| Maximum | real | The maximum of the two metric values pushed by the two MSEEs |
| Average | real | Equal to (Minimum + Maximum)/2 |
| Total | real | Sum of the two metric values from both MSEEs (the main value to focus on for the metric queried) |
Analyzing logs
Data in Azure Monitor Logs is stored in tables where each table has its own set of unique properties.
All resource logs in Azure Monitor have the same fields followed by service-specific fields. The common schema is outlined in Azure Monitor resource log schema. The schema for ExpressRoute resource logs is found in the Azure ExpressRoute Data Reference.
The Activity log is a platform logging that provides insight into subscription-level events. You can view it independently or route it to Azure Monitor Logs, where you can do much more complex queries using Log Analytics.
ExpressRoute stores data in the following tables.
| Table | Description |
|---|---|
| AzureDiagnostics | Common table used by multiple services to store Resource logs. Resource logs from ExpressRoute can be identified with MICROSOFT.NETWORK. |
| AzureMetrics | Metric data emitted by ExpressRoute that measure their health and performance. |
To view these tables, navigate to your ExpressRoute circuit resource and select Logs under Monitoring.
Note
Azure diagnostic logs, such as BGP route table log are updated every 24 hours.
Analyze monitoring data
There are many tools for analyzing monitoring data.
Azure Monitor tools
Azure Monitor supports the following basic tools:
Metrics explorer, a tool in the Azure portal that allows you to view and analyze metrics for Azure resources. For more information, see Analyze metrics with Azure Monitor metrics explorer.
Log Analytics, a tool in the Azure portal that allows you to query and analyze log data by using the Kusto query language (KQL). For more information, see Get started with log queries in Azure Monitor.
The activity log, which has a user interface in the Azure portal for viewing and basic searches. To do more in-depth analysis, you have to route the data to Azure Monitor logs and run more complex queries in Log Analytics.
Tools that allow more complex visualization include:
- Dashboards that let you combine different kinds of data into a single pane in the Azure portal.
- Workbooks, customizable reports that you can create in the Azure portal. Workbooks can include text, metrics, and log queries.
- Grafana, an open platform tool that excels in operational dashboards. You can use Grafana to create dashboards that include data from multiple sources other than Azure Monitor.
- Power BI, a business analytics service that provides interactive visualizations across various data sources. You can configure Power BI to automatically import log data from Azure Monitor to take advantage of these visualizations.
Azure Monitor export tools
You can get data out of Azure Monitor into other tools by using the following methods:
Metrics: Use the REST API for metrics to extract metric data from the Azure Monitor metrics database. The API supports filter expressions to refine the data retrieved. For more information, see Azure Monitor REST API reference.
Logs: Use the REST API or the associated client libraries.
Another option is the workspace data export.
To get started with the REST API for Azure Monitor, see Azure monitoring REST API walkthrough.
Kusto queries
You can analyze monitoring data in the Azure Monitor Logs / Log Analytics store by using the Kusto query language (KQL).
Important
When you select Logs from the service's menu in the portal, Log Analytics opens with the query scope set to the current service. This scope means that log queries will only include data from that type of resource. If you want to run a query that includes data from other Azure services, select Logs from the Azure Monitor menu. See Log query scope and time range in Azure Monitor Log Analytics for details.
For a list of common queries for any service, see the Log Analytics queries interface.
Sample Kusto queries
These queries work with the new language.
Query for Border Gateway Protocol (BGP) route table learned over the last 12 hours.
AzureDiagnostics
| where TimeGenerated > ago(12h)
| where ResourceType == "EXPRESSROUTECIRCUITS"
| project TimeGenerated, ResourceType , network_s, path_s, OperationName
Query for BGP informational messages by level, resource type, and network.
AzureDiagnostics
| where Level == "Informational"
| where ResourceType == "EXPRESSROUTECIRCUITS"
| project TimeGenerated, ResourceId , Level, ResourceType , network_s, path_s
Query for Traffic graph BitInPerSeconds in the last one hour.
AzureMetrics
| where MetricName == "BitsInPerSecond"
| summarize by Average, bin(TimeGenerated, 1h), Resource
| render timechart
Query for Traffic graph BitOutPerSeconds in the last one hour.
AzureMetrics
| where MetricName == "BitsOutPerSecond"
| summarize by Average, bin(TimeGenerated, 1h), Resource
| render timechart
Query for graph of ArpAvailability in 5-minute intervals.
AzureMetrics
| where MetricName == "ArpAvailability"
| summarize by Average, bin(TimeGenerated, 5m), Resource
| render timechart
Query for graph of BGP availability in 5-minute intervals.
AzureMetrics
| where MetricName == "BGPAvailability"
| summarize by Average, bin(TimeGenerated, 5m), Resource
| render timechart
Alerts
Azure Monitor alerts proactively notify you when specific conditions are found in your monitoring data. Alerts allow you to identify and address issues in your system before your customers notice them. For more information, see Azure Monitor alerts.
There are many sources of common alerts for Azure resources. For examples of common alerts for Azure resources, see Sample log alert queries. The Azure Monitor Baseline Alerts (AMBA) site provides a semi-automated method of implementing important platform metric alerts, dashboards, and guidelines. The site applies to a continually expanding subset of Azure services, including all services that are part of the Azure Landing Zone (ALZ).
The common alert schema standardizes the consumption of Azure Monitor alert notifications. For more information, see Common alert schema.
Types of alerts
You can alert on any metric or log data source in the Azure Monitor data platform. There are many different types of alerts depending on the services you're monitoring and the monitoring data you're collecting. Different types of alerts have various benefits and drawbacks. For more information, see Choose the right monitoring alert type.
The following list describes the types of Azure Monitor alerts you can create:
- Metric alerts evaluate resource metrics at regular intervals. Metrics can be platform metrics, custom metrics, logs from Azure Monitor converted to metrics, or Application Insights metrics. Metric alerts can also apply multiple conditions and dynamic thresholds.
- Log alerts allow users to use a Log Analytics query to evaluate resource logs at a predefined frequency.
- Activity log alerts trigger when a new activity log event occurs that matches defined conditions. Resource Health alerts and Service Health alerts are activity log alerts that report on your service and resource health.
Some Azure services also support smart detection alerts, Prometheus alerts, or recommended alert rules.
For some services, you can monitor at scale by applying the same metric alert rule to multiple resources of the same type that exist in the same Azure region. Individual notifications are sent for each monitored resource. For supported Azure services and clouds, see Monitor multiple resources with one alert rule.
Note
During maintenance between the Microsoft edge and core network, BGP availability appears down even if the BGP session between the customer edge and Microsoft edge remains up. For information about maintenance between the Microsoft edge and core network, make sure to have your maintenance alerts turned on and configured.
Note
If you're creating or running an application that runs on your service, Azure Monitor application insights might offer more types of alerts.
ExpressRoute alert rules
The following table lists some suggested alert rules for ExpressRoute. These alerts are just examples. You can set alerts for any metric, log entry, or activity log entry listed in the Azure ExpressRoute monitoring data reference.
| Alert type | Condition | Description |
|---|---|---|
| ARP availability down | Dimension name: Peering Type, Aggregation type: Avg, Operator: Less than, Threshold value: 100% | When ARP availability is down for a peering type. |
| BGP availability down | Dimension name: Peer, Aggregation type: Avg, Operator: Less than, Threshold value: 100% | When BGP availability is down for a peer. |
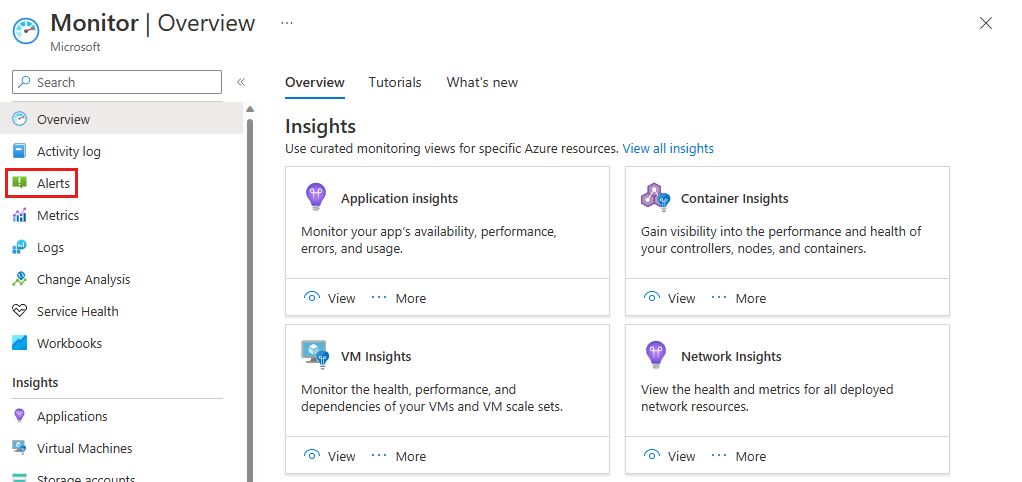
Alerts for ExpressRoute gateway connections
To configure alerts, navigate to Azure Monitor, then select Alerts.
Select + Create > Alert rule and select the ExpressRoute gateway connection resource. Select Next: Condition > to configure the signal.
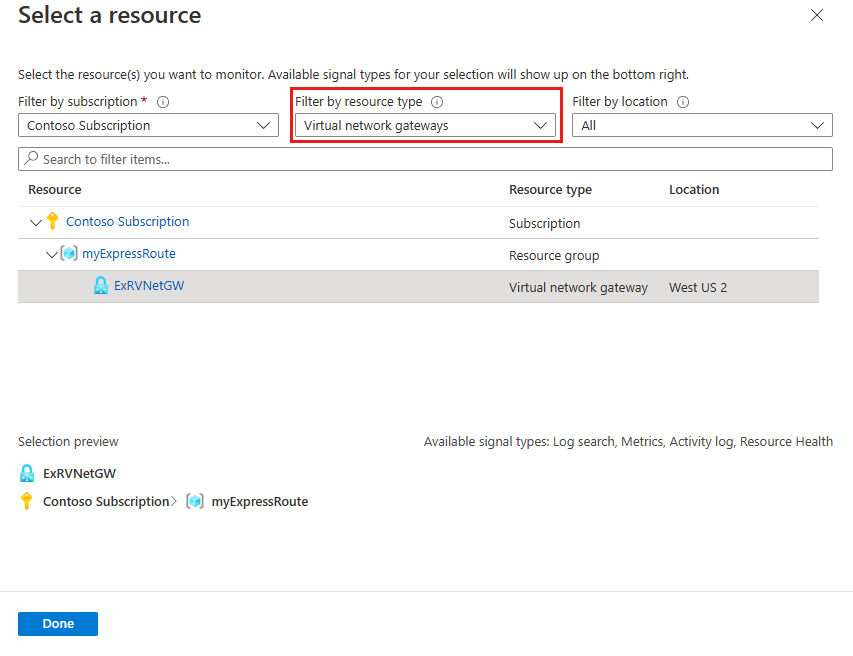
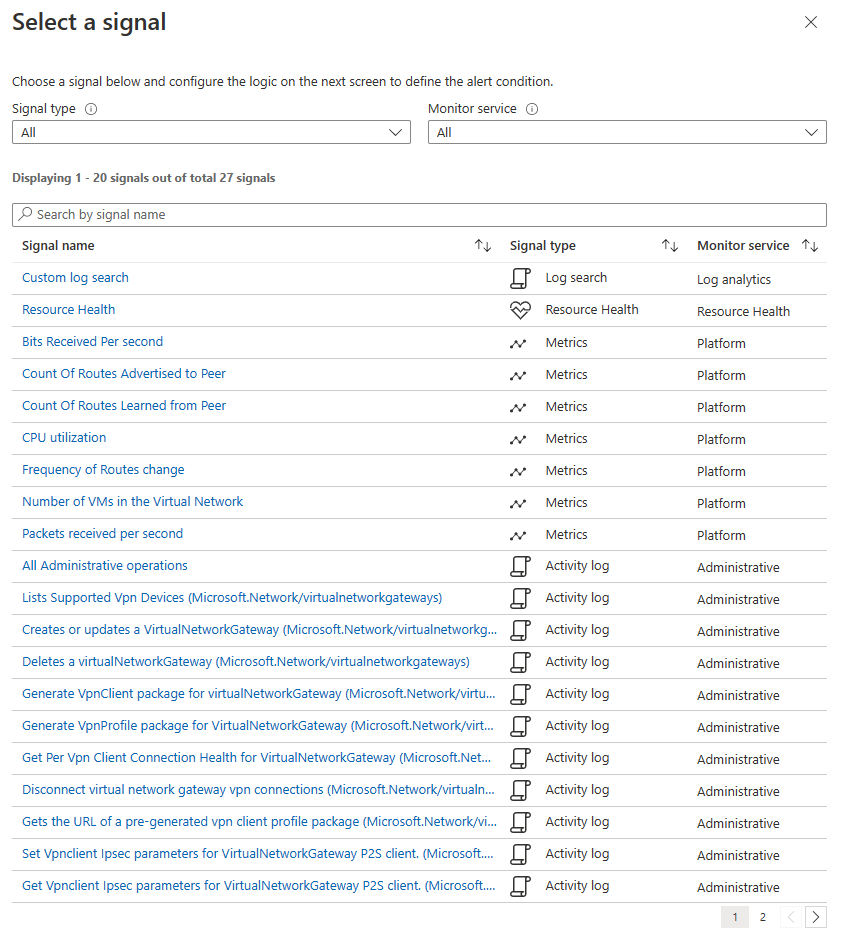
On the Select a signal page, select a metric, resource health, or activity log that you want to be alerted. Depending on the signal you select, you might need to enter additional information such as a threshold value. You can also combine multiple signals into a single alert. Select Next: Actions > to define who and how they get notify.
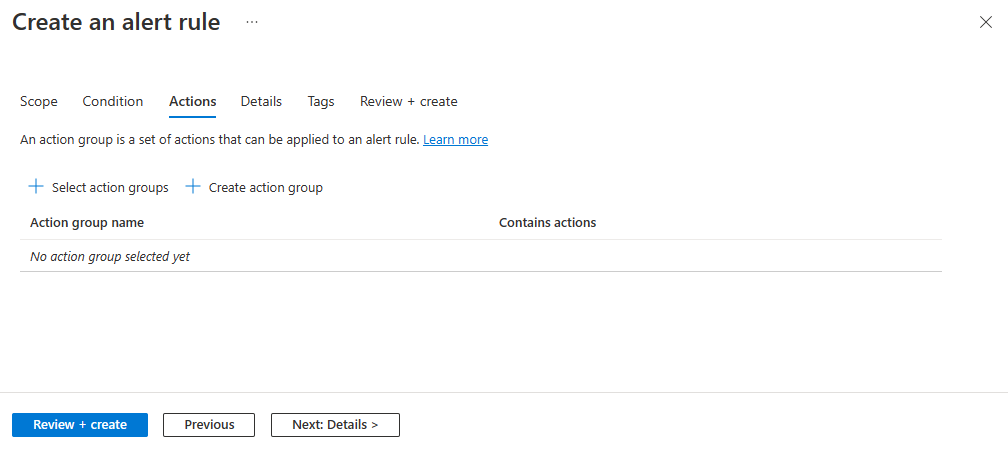
Select + Select action groups to choose an existing action group you previously created or select + Create action group to define a new one. In the action group, you determine how notifications get sent and who receives them.
Select Review + create and then Create to deploy the alert into your subscription.
Advisor recommendations
For some services, if critical conditions or imminent changes occur during resource operations, an alert displays on the service Overview page in the portal. You can find more information and recommended fixes for the alert in Advisor recommendations under Monitoring in the left menu. During normal operations, no advisor recommendations display.
For more information on Azure Advisor, see Azure Advisor overview.
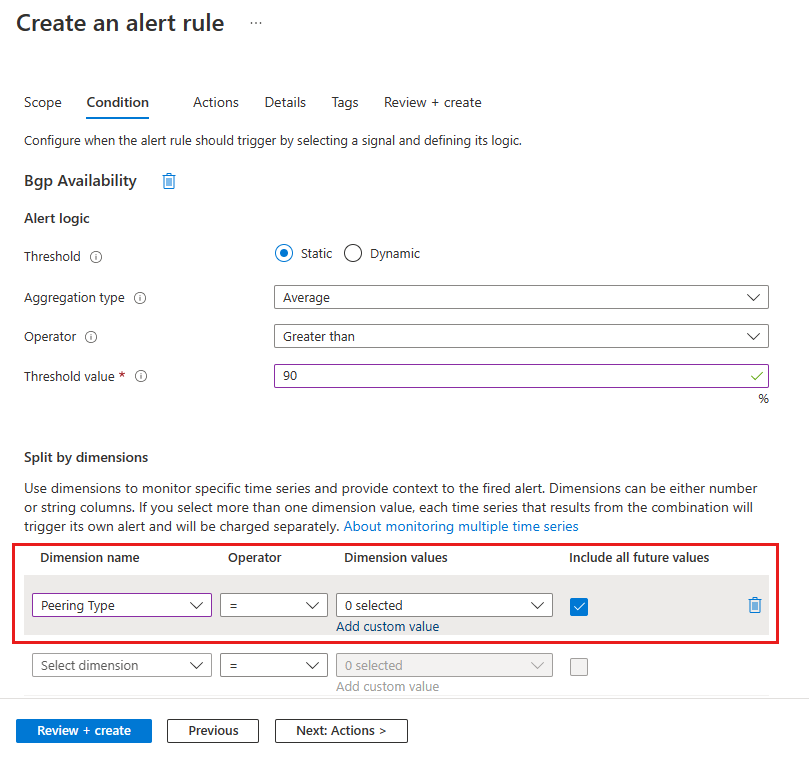
Alerts based on each peering
After you select a metric, certain metric allow you to set up dimensions based on peering or a specific peer (virtual networks).
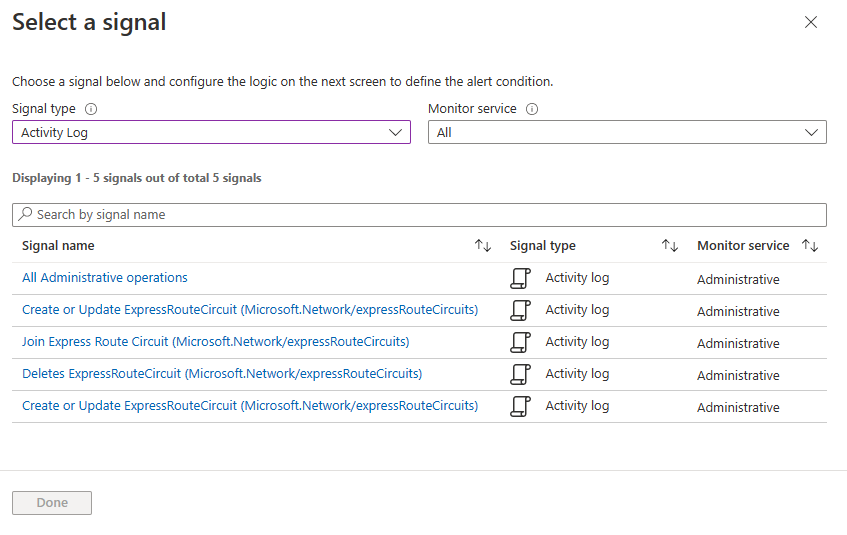
Configure alerts for activity logs on circuits
When selecting signals to be alerted on, you can select Activity Log signal type.
Related content
- See Azure ExpressRoute monitoring data reference for a reference of the metrics, logs, and other important values created for ExpressRoute.
- See Monitoring Azure resources with Azure Monitor for general details on monitoring Azure resources.
Feedback
În curând: Pe parcursul anului 2024, vom elimina treptat Probleme legate de GitHub ca mecanism de feedback pentru conținut și îl vom înlocui cu un nou sistem de feedback. Pentru mai multe informații, consultați: https://aka.ms/ContentUserFeedback.
Trimiteți și vizualizați feedback pentru