Walkthrough 6: Configure the Debugger hosted control in your agent application
Unified Service Desk provides a Debugger type of hosted control, which provides you key information about your Unified Service Desk configuration that helps you to successfully build an agent application and troubleshoot issues in your configuration. More information: Debug issues in Unified Service Desk
This walkthrough demonstrates how to configure a Debugger hosted control for your agent application.
Prerequisites
You must have completed Walkthrough 1: Build a simple agent application and Walkthrough 3: Display records in your agent application. The configurations that you completed in those walkthroughs are required in this walkthrough.
This walkthrough assumes that you’ll be using the same user credential that you used in walkthrough 1 to sign in to the agent application at the end of the walkthrough to test the application. If a different user will be testing the application, you must assign the user to Contoso Configuration. More information: Walkthrough 1: Build a simple agent application
You must know about the following in Unified Service Desk:
Debugger hosted control. More information: Debugger (Hosted Control)
Action call and how to configure it. More information: Action calls
Filter access using Unified Service Desk configuration. More information: Manage access using Unified Service Desk configuration
In This Walkthrough
Step 1: Create a Debugger type of hosted control
Step 2: Add toolbar button and action call to display the Debugger hosted control
Step 3: Add the controls to the configuration
Step 1: Create a Debugger type of hosted control
Sign in to the Dynamics 365 instance.
Go to Settings > Unified Service Desk.
Click Hosted Controls.
Click New.
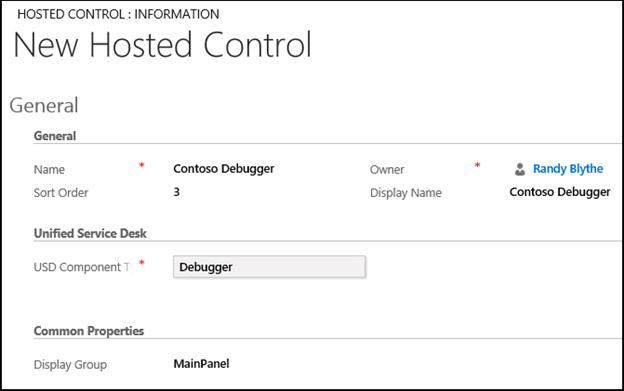
On the New Hosted Control page, specify the following values:
Field Value Name Contoso Debugger Sort Order 3 Display Name Contoso Debugger USD Component Type Debugger Display Group MainPanel 
Click Save.
Step 2: Add toolbar button and action call to display the Debugger hosted control
Add a toolbar button to Contoso Main Toolbar (created in Walkthrough 3: Display records in your agent application), and then add an action call for the button to display the Contoso Debugger hosted control that you created in step 1.
Sign in to the Dynamics 365 instance.
Go to Settings > Unified Service Desk.
Click Toolbars.
Click Contoso Main Toolbar.
In the Buttons area, click + to add a toolbar button.
On the New Toolbar Button page, specify the following values.
Field Value Name Contoso Debugger Button Button Text DEBUGGER Order 3 Note: The Order field defines the position of buttons in the toolbar. Buttons are arranged from left to right or top to bottom in an ascending order. Click Save.
In the Actions area, click + to create an action call for the button
In the search box, press ENTER or click the search icon, and then click New in the lower-right corner of the search results pane to create an action call.
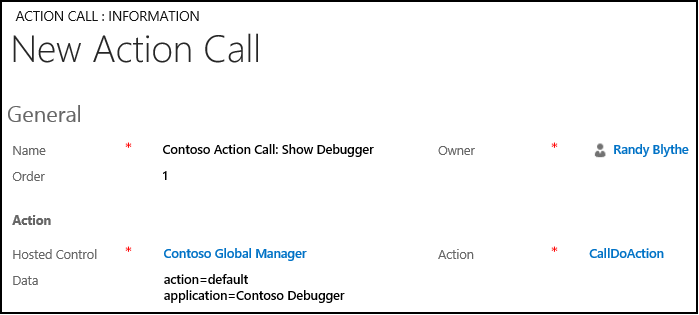
On the New Action Call page, specify the following values.
Field Value Name Contoso Action Call: Show Debugger Order 1 Hosted Control Contoso Global Manager Action CallDoAction Data action=default
application=Contoso Debugger
Click Save.
Step 3: Add the controls to the configuration
Add the action call and hosted control that you created in this walkthrough to Contoso Configuration to display these controls to the user who is assigned to the configuration. Contoso Configuration was created in Walkthrough 1: Build a simple agent application.
Add the following to Contoso Configuration.
| Control name | Control type |
|---|---|
| Contoso Action Call: Show Debugger | Action Call |
| Contoso Debugger | Hosted Control |
To add a control to the configuration:
Sign in to the Dynamics 365 instance.
Go to Settings > Unified Service Desk.
Click Configuration.
Click Contoso Configuration to open the definition.
On the nav bar, click the down arrow next to Contoso Configuration, and select Action Calls.
On the next page, click Add Existing Action Call, type “
Contoso Action Call: Show Debugger” in the search bar, and then press ENTER or click the search icon.In the search results, click the action call name to add it.
Similarly, add the hosted control by clicking the down arrow next to Contoso Configuration, and clicking Hosted Controls.
Click Save.
Step 4: Test the application
Start the Unified Service Desk client application, and sign in to the Dynamics 365 instance where you configured Unified Service Desk using the same user credentials that you assigned to the Contoso Configuration in Walkthrough 1: Build a simple agent application. For information about connecting to Dataverse instance using the Unified Service Desk client application, see Connect to a model-driven app instance using the Unified Service Desk client.
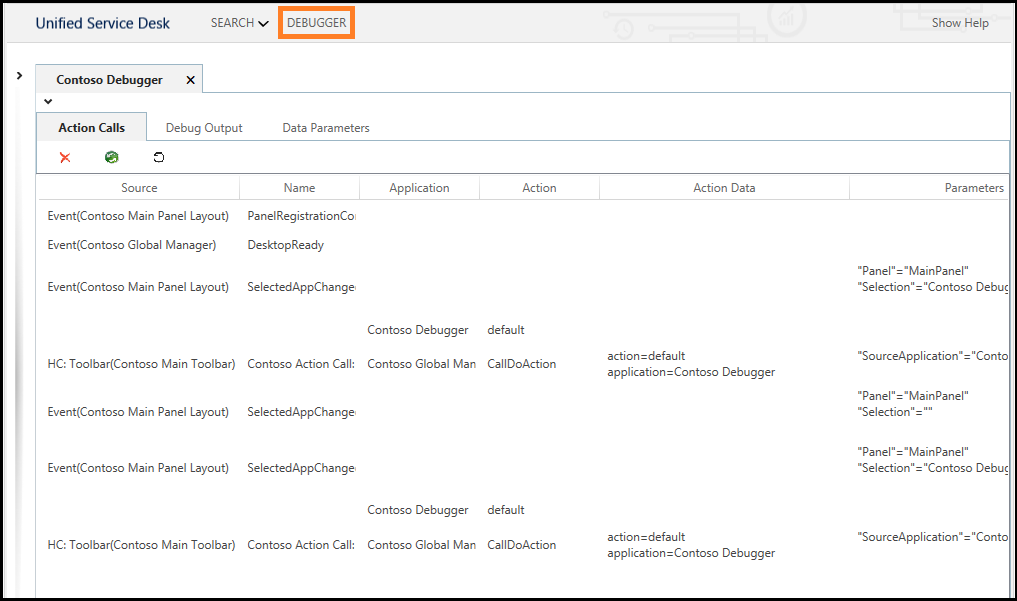
Your agent application will now have a DEBUGGER button in the toolbar area. Clicking this button displays the Debugger control.

Conclusion
In this walkthrough, you saw how to configure the Debugger hosted control in your agent application. You also learned how to filter access to Unified Service Desk controls using configuration.
See also
Walkthrough 1: Build a simple agent application
Walkthrough 2: Display an external webpage in your agent application
Walkthrough 3: Display records in your agent application
Walkthrough 4: Display a record in a session in your agent application
Walkthrough 5: Display enhanced session information by displaying session name and overview data
Walkthrough 7: Configure agent scripting in your agent application