Evenimente
Campionatele Mondiale Power BI DataViz
14 feb., 16 - 31 mar., 16
Cu 4 șanse de a intra, ai putea câștiga un pachet de conferință și ai putea ajunge la Marea Finală LIVE din Las Vegas
Aflați mai multeAcest browser nu mai este acceptat.
Faceți upgrade la Microsoft Edge pentru a profita de cele mai noi funcții, actualizări de securitate și asistență tehnică.
APPLIES TO: ![]() Power BI Desktop
Power BI Desktop ![]() Power BI service
Power BI service
This article explains how to add a visualization filter, page filter, or report filter to a report in Power BI. You need to be able to edit a report to add filters. The examples in this article are in the Power BI service, and the steps are almost identical in Power BI Desktop.

Whether you're using Power BI Desktop or Power BI service, the Filters pane displays along the right side of the report canvas. If you don't see the Filters pane, select the ">" icon from the upper-right corner to expand it.
You can set filters at three different levels for the report:
This article explains how to set the different levels.
Visuals have two different kinds of filters. The fields that are in a visual are automatically filters for that visual. As the report designer, you can identify a field that isn't already the visual, and add that field directly to the Visual level filters bucket.
By the way, this article uses the Retail Analysis sample, if you'd like to install it and follow along. Install the Retail Analysis sample.
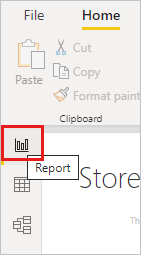
In Power BI Desktop, select the Report icon.
Open the Visualizations, Filters, and Fields panes, if they're not already open.

To make a visual active, select it. In this case, it's the scatter chart on the Overview page. All the fields in the visual are in the Visualizations pane. They're also listed in the Filters pane, under the Filters on this visual heading.

From the Fields pane, select the field you want to add as a new visual-level filter, and drag it into the Filters on this visual area. In this example, we drag Category to Add data fields here.

Notice Category isn't added to the visualization itself.
Select Kids. The scatter chart is filtered, but the other visuals stay the same.

If you save your report with this filter, report readers can interact with the Category filter in Reading view, selecting or clearing values.
If you drag a numeric column to the filter pane to create a visual-level filter, the filter is applied to the underlying rows of data. For example, adding a filter on the UnitCost field and setting it where UnitCost > 20 would only show data for the Product rows where the Unit Cost was greater than 20, regardless of the total Unit Cost for the data points shown in the visual.
You can also add a page-level filter to filter an entire page.
In Power BI Desktop, open the Retail Analysis report.
Select the Report icon, then go to the District Monthly Sales page.
Open the Visualizations, Filters, and Fields panes, if they're not already open.
From the Fields pane, select the field you want to add as a new page-level filter, and drag it to Add data fields here in the Filters on this page area. In this case, we added District Manager.

Select the values you want to filter and set either Basic or Advanced filtering controls.
All the visualizations on the page are redrawn to reflect the change.
If you save your report with the filter, report readers can interact with the filter in Reading view, selecting or clearing values.
In Power BI Desktop, select the Report icon.
Open the Visualizations and Filters pane and the Fields pane, if they're not already open.
From the Fields pane, select the field you want to add as a new report-level filter, and drag it into the Report level filters area.
Select the values you want to filter.
The visuals on the active page, and on all pages in the report, change to reflect the new filter. If you save your report with the filter, report readers can interact with the filter in Reading view, selecting or clearing values.
Select the back arrow to return to the previous report page.
Because filters persist, when you navigate away from the report Power BI retains the filter, slicer, and other data view changes that you made. So you can pick up where you left off when you return to the report. If you don't want your filter changes to persist, select Reset to default from the top menu bar.
![]()
Keep in mind that as the report creator, whatever filters you save with the report become the default filter state for all your report readers. When they select Reset to default, that's what they return to.
More questions? Try the Power BI Community.
Evenimente
Campionatele Mondiale Power BI DataViz
14 feb., 16 - 31 mar., 16
Cu 4 șanse de a intra, ai putea câștiga un pachet de conferință și ai putea ajunge la Marea Finală LIVE din Las Vegas
Aflați mai multeInstruire
Modul
Configure Power BI report filters - Training
Report filtering is a complex topic because many techniques are available for filtering a Microsoft Power BI report. However, with complexity comes control, allowing you to design reports that meet requirements and expectations.
Certificare
Certificat Microsoft: Asociat analist de date Power BI - Certifications
Demonstrați metode și cele mai bune practici care se aliniază cu cerințele de afaceri și tehnice pentru modelarea, vizualizarea și analiza datelor cu Microsoft Power BI.
Documentație
Format filters in Power BI reports - Power BI
Learn how to use Power BI to control your report filter format, design, and functionality to look like the rest of the report.
Slicers in Power BI - Power BI
A Power BI slicer is an alternate way of filtering. It narrows the portion of the semantic model shown in the other visualizations in a report you design.
Types of filters in Power BI reports - Power BI
Learn about types of filters for reports in Power BI, including the page filter, the visualization filter, and the report filter.