Evenimente
Campionatele Mondiale Power BI DataViz
14 feb., 16 - 31 mar., 16
Cu 4 șanse de a intra, ai putea câștiga un pachet de conferință și ai putea ajunge la Marea Finală LIVE din Las Vegas
Aflați mai multeAcest browser nu mai este acceptat.
Faceți upgrade la Microsoft Edge pentru a profita de cele mai noi funcții, actualizări de securitate și asistență tehnică.
APPLIES TO: ![]() Power BI Report Builder
Power BI Report Builder ![]() Power BI Desktop
Power BI Desktop
Power BI Report Builder is a tool for authoring paginated reports that you can publish to the Power BI service. Paginated reports are designed to be printed or shared. They're formatted to fit well on a page, and they display all the data in a table, even if the table spans multiple pages. When you design a paginated report, you're creating a report definition that specifies what data to retrieve, where to get it, and how to display it. When you run the report, the report processor takes the report definition you have specified, retrieves the data, and combines it with the report layout to generate the report. You preview your report in Report Builder. Then publish your report to the Power BI service. See What are paginated reports in Power BI? for more background.
Ready to start authoring? Install Power BI Report Builder from the Microsoft Download Center.
Prefer learning from videos? Check out the Video-based course: Power BI Paginated Reports in a Day.
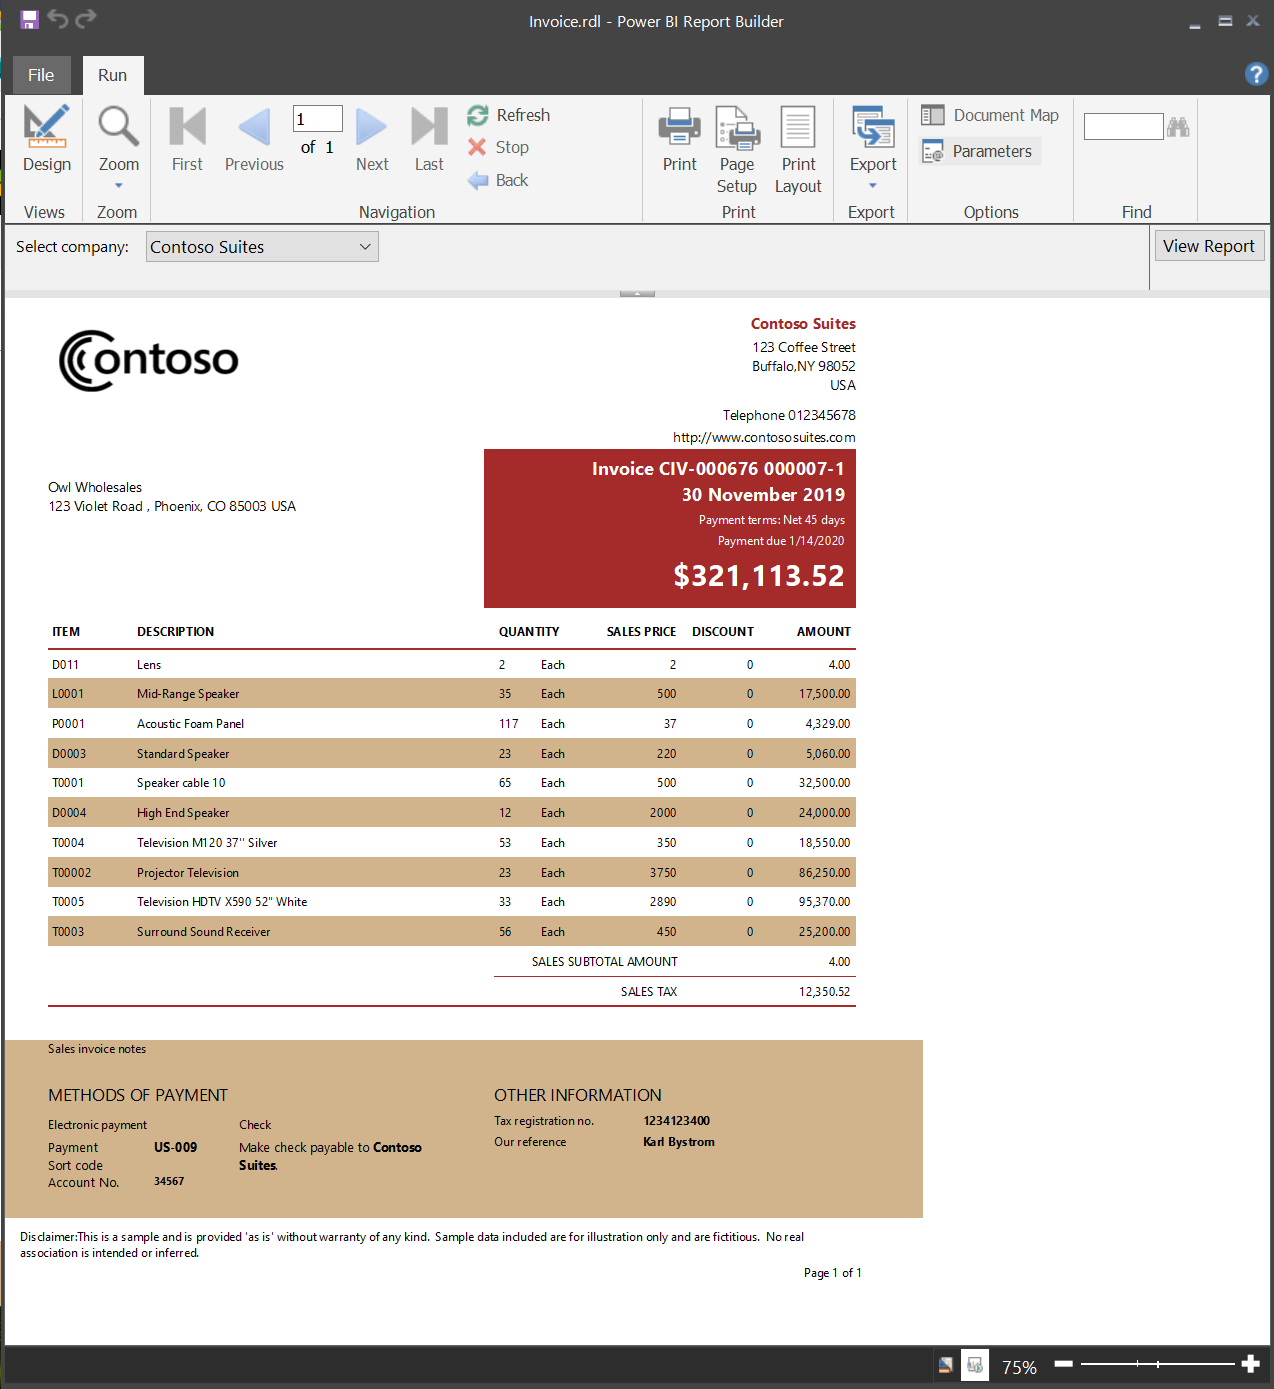
The following paginated report is a sample of an invoice. You can download it and other samples, such as letters, transcripts, and labels. Read more about sample Power BI paginated reports.
See the System requirements section of the Power BI Report Builder download page on the Microsoft Download Center.
License requirements for Power BI paginated reports (.rdl files) are the same as for Power BI reports (.pbix files).
Create a data source connection, drag and drop fields to create a dataset query, select a layout and style, add accessibility row properties, and customize your report.
Create reports that display aggregated data against a geographic or geometric background. Map data can be spatial data from a Transact-SQL query or an Environmental Systems Research Institute, Inc. (ESRI) shapefile. You can also add a Microsoft Bing map tile background.
Create paginated reports with table, matrix, chart, and free-form report layouts. Create table reports for column-based data, matrix reports (like cross-tab or PivotTable reports) for summarized data, chart reports for graphical data, and free-form reports for anything else. Reports can embed other reports and charts, together with lists, graphics, and controls for dynamic Web-based applications.
Report from a variety of data sources. You can create reports that use relational and multidimensional data from SQL Server and Analysis Services, Oracle, Power BI semantic models, and other databases.
Modify existing reports. By using Report Builder, you can customize and update reports that were created in SQL Server Data Tools (SSDT) Report Designer.
Modify your data. Filter, group, and sort data, or add formulas or expressions.
Add charts, gauges, sparklines, and indicators. Summarize data in a visual format, and present large volumes of aggregated information at a glance.
Add interactive features such as document maps, show/hide buttons, and drillthrough links to subreports and drillthrough reports. Use parameters and filters to filter data for customized views.
Embed or reference images and other resources, including external content.
Save the definition of the report to your computer or to the report server, where you can manage it and share it with others.
Choose a presentation format when you open the report, or after you open the report. You can select Web-oriented, page-oriented, and desktop application formats. Formats include MHTML, PDF, XML, CSV, Word, and Excel.
Set up subscriptions. After you publish the report to the Power BI service, you can configure your report to run at a specific time and send as an e-mail subscription.
In the Power BI service, you can use the deployment pipeline tool with paginated reports. Deployment pipelines let you develop and test your Power BI paginated reports before you release them to your users. The tool is a pipeline with three stages:
Read about how to get started with deployment pipelines in the Power BI service.
You might not be able to configure Parameters as both "Multi-value" and "Allow null". "Multi value" and "Allow blank" is an allowed combination but Null is treated differently.
Power BI Report Builder is fully supported on Azure Virtual Desktop (formerly Windows Virtual Desktop) and Windows 365.
Running Power BI Report Builder as a virtualized application (for example, as a Citrix application) isn't supported.
Evenimente
Campionatele Mondiale Power BI DataViz
14 feb., 16 - 31 mar., 16
Cu 4 șanse de a intra, ai putea câștiga un pachet de conferință și ai putea ajunge la Marea Finală LIVE din Las Vegas
Aflați mai multeInstruire
Cale de învățare
Dezvoltați rapoarte cu Microsoft Power BI DP-605T00 - Training
Power BI vă permite să vă conectați și să prezentați cu ușurință datele într-un raport interactiv, astfel încât să puteți lua decizii bazate pe date. Aflați cum să vă conectați la date, cum să transformați și să formați date și cum să creați elemente vizuale interactive într-un raport Power BI. (DP-605T00)
Certificare
Certificat Microsoft: Asociat analist de date Power BI - Certifications
Demonstrați metode și cele mai bune practici care se aliniază cu cerințele de afaceri și tehnice pentru modelarea, vizualizarea și analiza datelor cu Microsoft Power BI.
Documentație
What are paginated reports in Power BI? - Power BI
Paginated reports are now available in the Power BI service. They have long been the standard report format in SQL Server Reporting Services, and now they're available in the Power BI service. These reports can be printed or shared. You can control the report layout exactly. They display all the data in a table, for example, even if the table spans multiple pages.
Sample Power BI paginated reports - Power BI
In this article, you learn about how to download and use sample Power BI paginated reports.
Tutorial: Create a paginated report and upload it to the Power BI service - Power BI
Learn how to connect to a sample Azure SQL database, use a wizard in Report Builder to create a paginated report, then upload it to any workspace in the Power BI service.