Udalosti
Vytváranie inteligentných aplikácií
17. 3., 21 - 21. 3., 10
Pripojte sa k sérii meetup a vytvorte škálovateľné riešenia AI na základe prípadov reálneho používania so spolupracovníkmi a odborníkmi.
Zaregistrovať saTento prehliadač už nie je podporovaný.
Inovujte na Microsoft Edge a využívajte najnovšie funkcie, aktualizácie zabezpečenia a technickú podporu.
Rules in Prometheus act on data as it's collected. They're configured as part of a Prometheus rule group, which is applied to Prometheus metrics in Azure Monitor workspace.
There are two types of Prometheus rules as described in the following table.
| Type | Description |
|---|---|
| Alert | Alert rules let you create an Azure Monitor alert based on the results of a Prometheus Query Language (Prom QL) query. Alerts fired by Azure Managed Prometheus alert rules are processed and trigger notifications in similar way to other Azure Monitor alerts. |
| Recording | Recording rules allow you to precompute frequently needed or computationally extensive expressions and store their result as a new set of time series. Time series created by recording rules are ingested back to your Azure Monitor workspace as new Prometheus metrics. |
Azure Managed Prometheus rule groups, recording rules and alert rules can be created and configured using The Azure resource type Microsoft.AlertsManagement/prometheusRuleGroups, where the alert rules and recording rules are defined as part of the rule group properties. Prometheus rule groups are defined with a scope of a specific Azure Monitor workspace. Prometheus rule groups can be created using Azure Resource Manager (ARM) templates, API, Azure CLI, or PowerShell.
Azure managed Prometheus rule groups follow the structure and terminology of the open source Prometheus rule groups. Rule names, expression, 'for' clause, labels, annotations are all supported in the Azure version. The following key differences between OSS rule groups and Azure managed Prometheus should be noted:
Poznámka
For your AKS or ARC Kubernetes clusters, you can use some of the recommended alerts rules. See pre-defined alert rules here.
You can optionally limit the rules in a rule group to query data originating from a single specific cluster, by adding a cluster scope to your rule group, and/or by using the rule group clusterName property.
You should limit rules to a single cluster if your Azure Monitor workspace contains a large amount of data from multiple clusters. In such a case, there's a concern that running a single set of rules on all the data may cause performance or throttling issues. By using the cluster scope, you can create multiple rule groups, each configured with the same rules, with each group covering a different cluster.
To limit your rule group to a cluster scope using an ARM template, you should add the Azure Resource ID of your cluster to the rule group scopes[] list. The scopes list must still include the Azure Monitor workspace resource ID. The following cluster resource types are supported as a cluster scope:
In addition to the cluster ID, you can configure the clusterName property of your rule group. The 'clusterName' property must match the cluster label that is added to your metrics when scraped from a specific cluster. By default, this label is set to the last part (resource name) of your cluster ID. If you've changed this label using the 'cluster_alias' setting in your cluster scraping configmap, you must include the updated value in the rule group 'clusterName' property. If your scraping uses the default 'cluster' label value, the 'clusterName' property is optional.
Here's an example of how a rule group is configured to limit query to a specific cluster:
{
    "name": "sampleRuleGroup",
    "type": "Microsoft.AlertsManagement/prometheusRuleGroups",
    "apiVersion": "2023-03-01",
    "location": "northcentralus",
    "properties": {
         "description": "Sample Prometheus Rule Group limited to a specific cluster",
         "scopes": [
             "/subscriptions/<subscription-id>/resourcegroups/<resource-group-name>/providers/microsoft.monitor/accounts/<azure-monitor-workspace-name>",
             "/subscriptions/<subscription-id>/resourcegroups/<resource-group-name>/providers/microsoft.containerservice/managedclusters/<myClusterName>"
         ],
         "clusterName": "<myCLusterName>",
         "rules": [
             {
                ...
             }
         ]
    }
}
If both cluster ID scope and clusterName aren't specified for a rule group, the rules in the group query data from all the clusters in the workspace from all clusters.
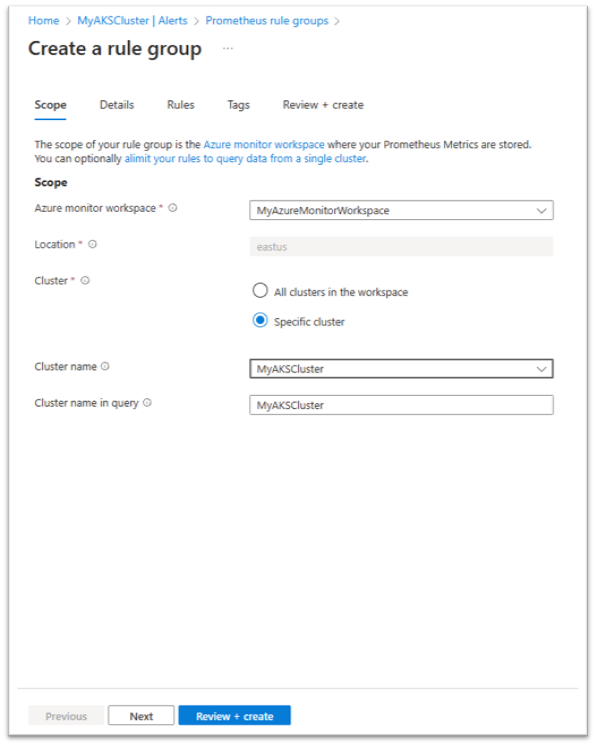
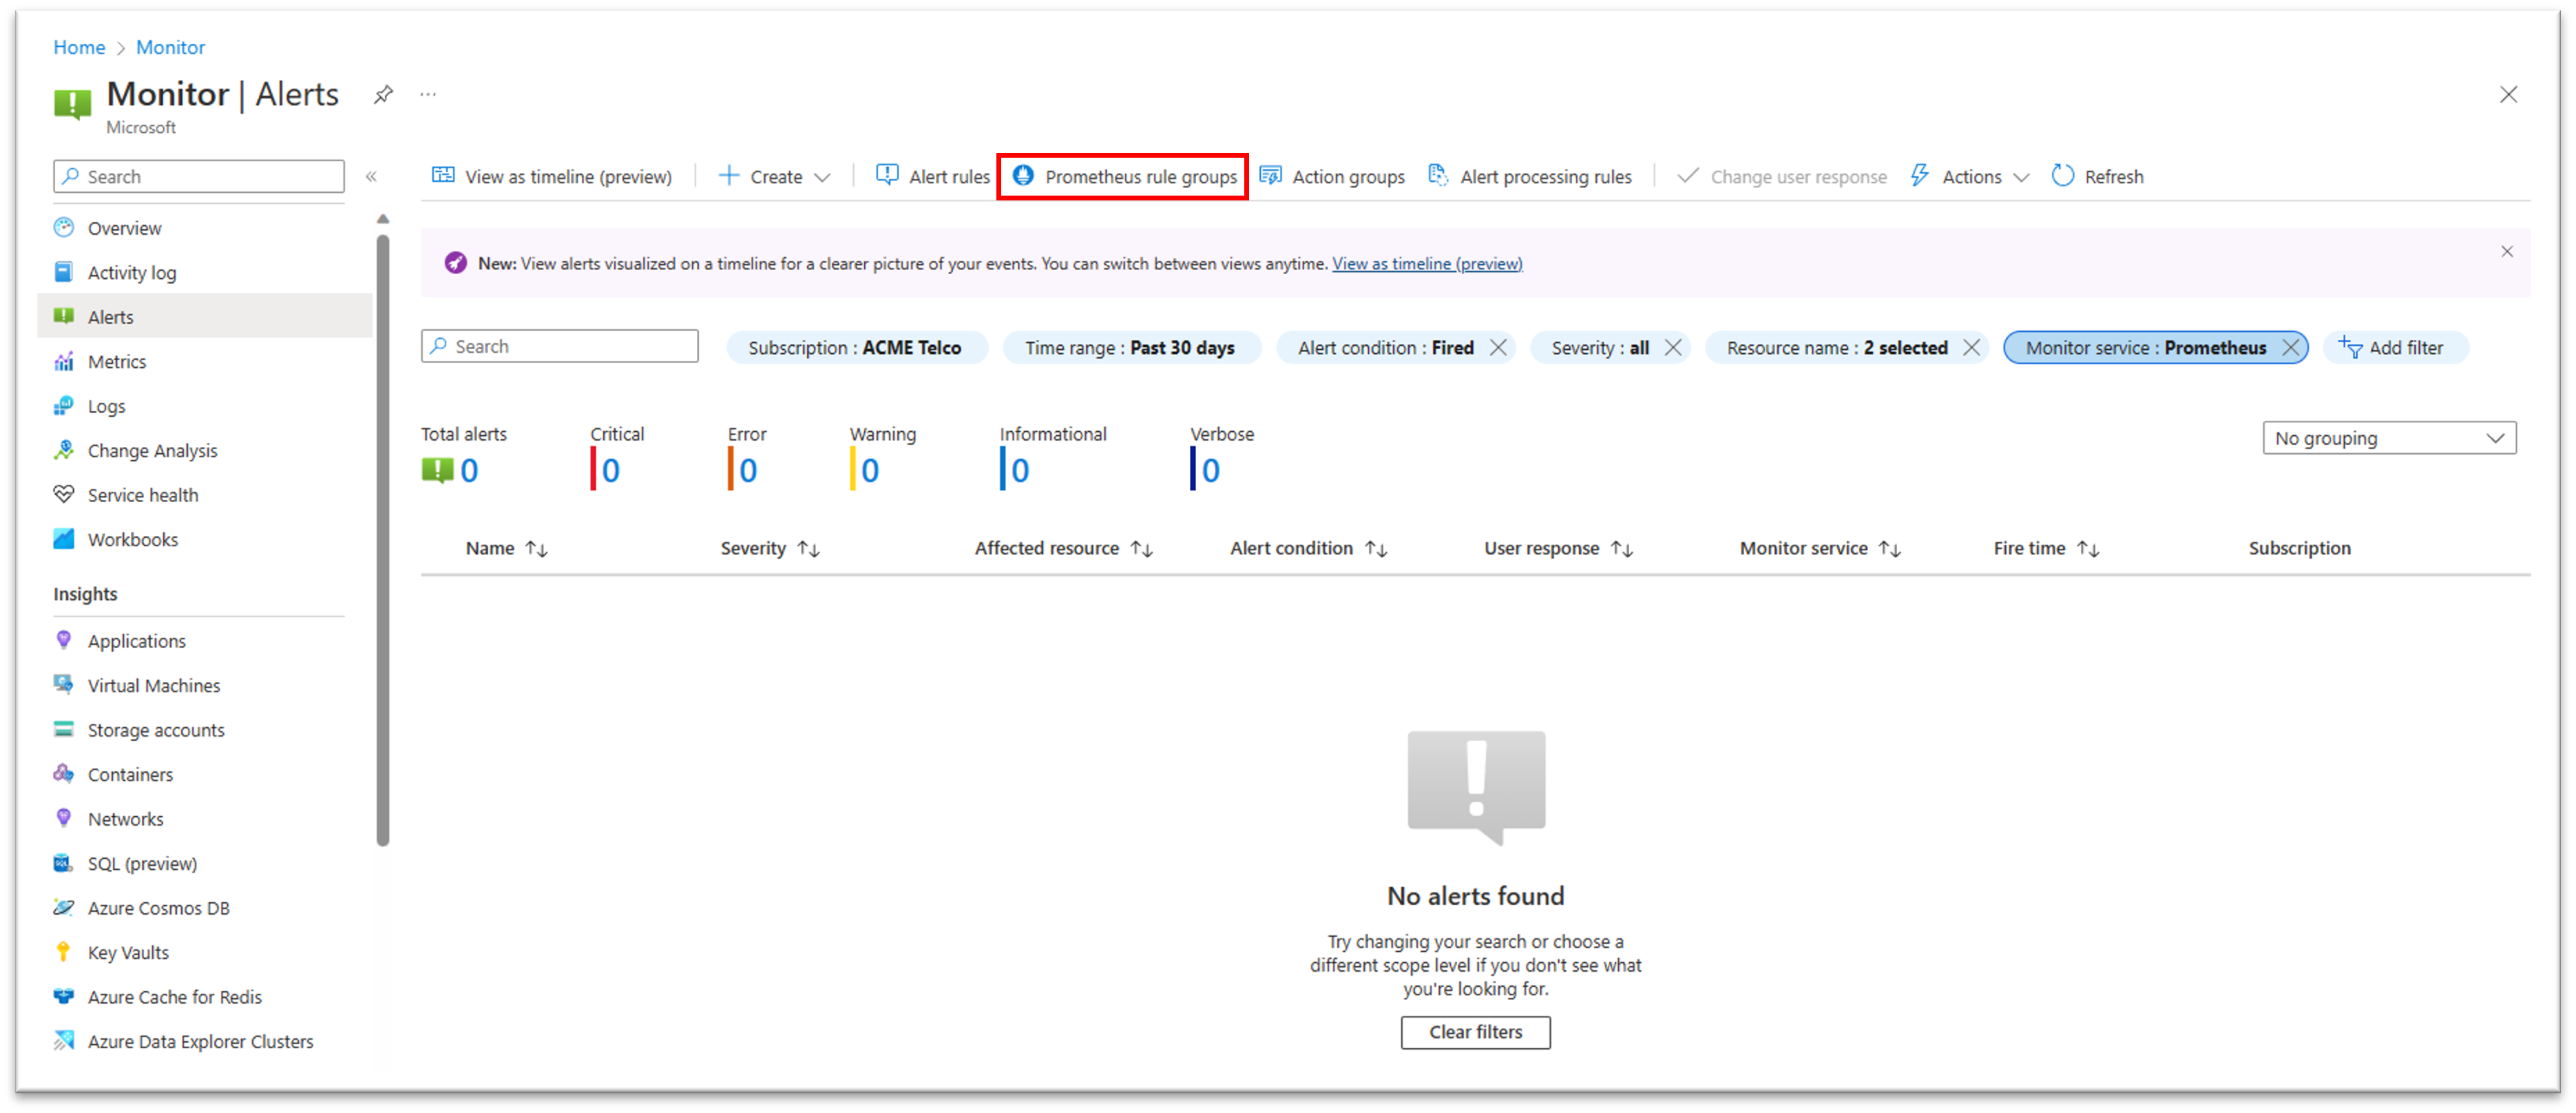
You can also limit your rule group to a cluster scope using the portal UI.
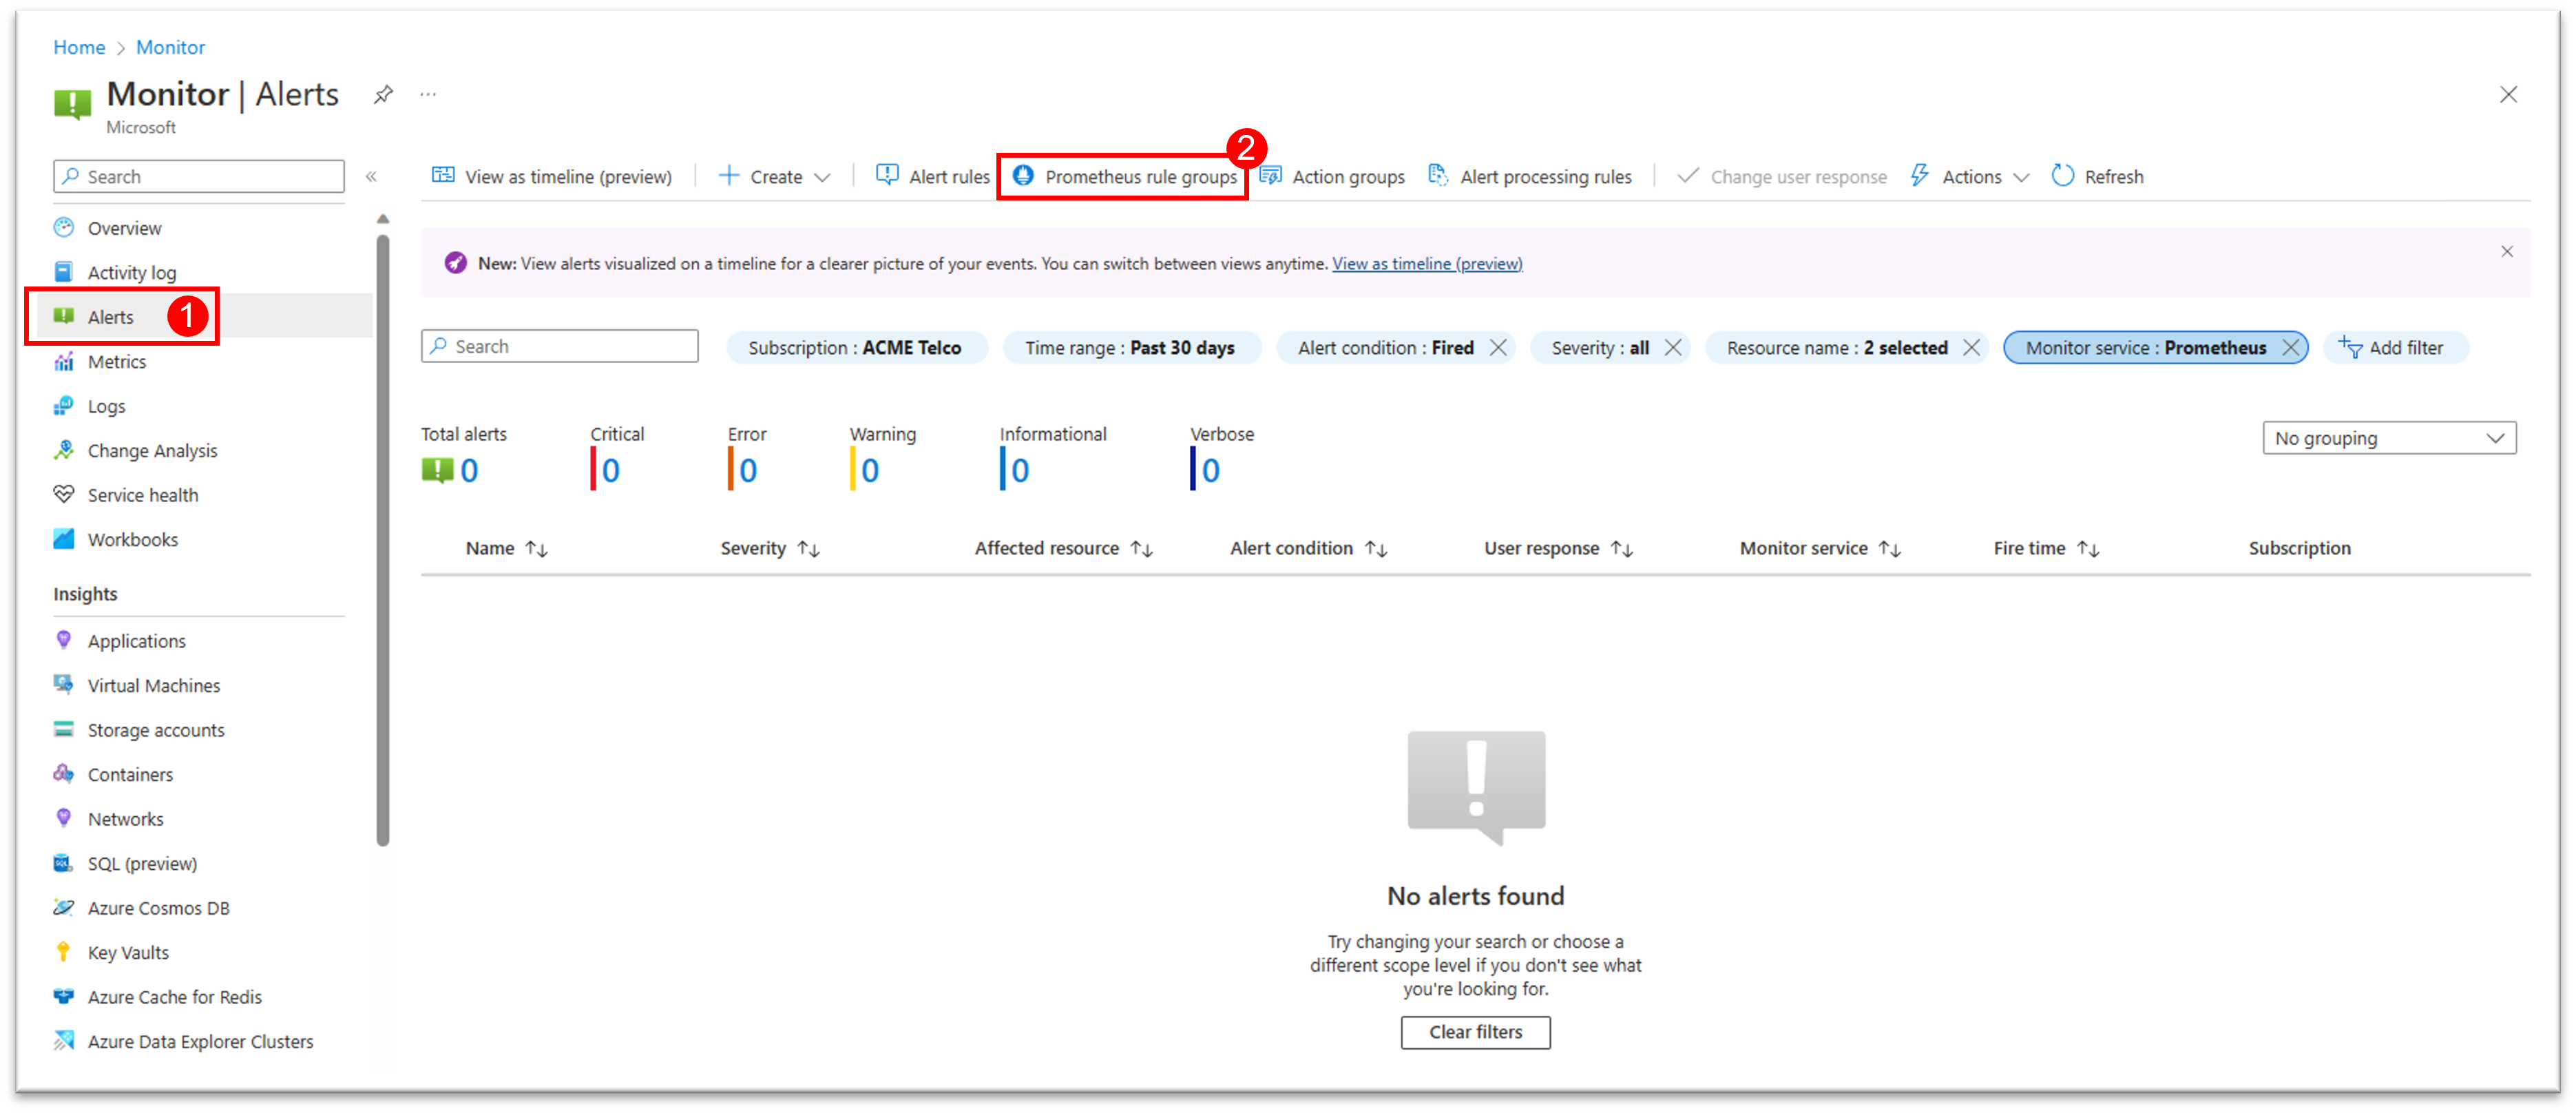
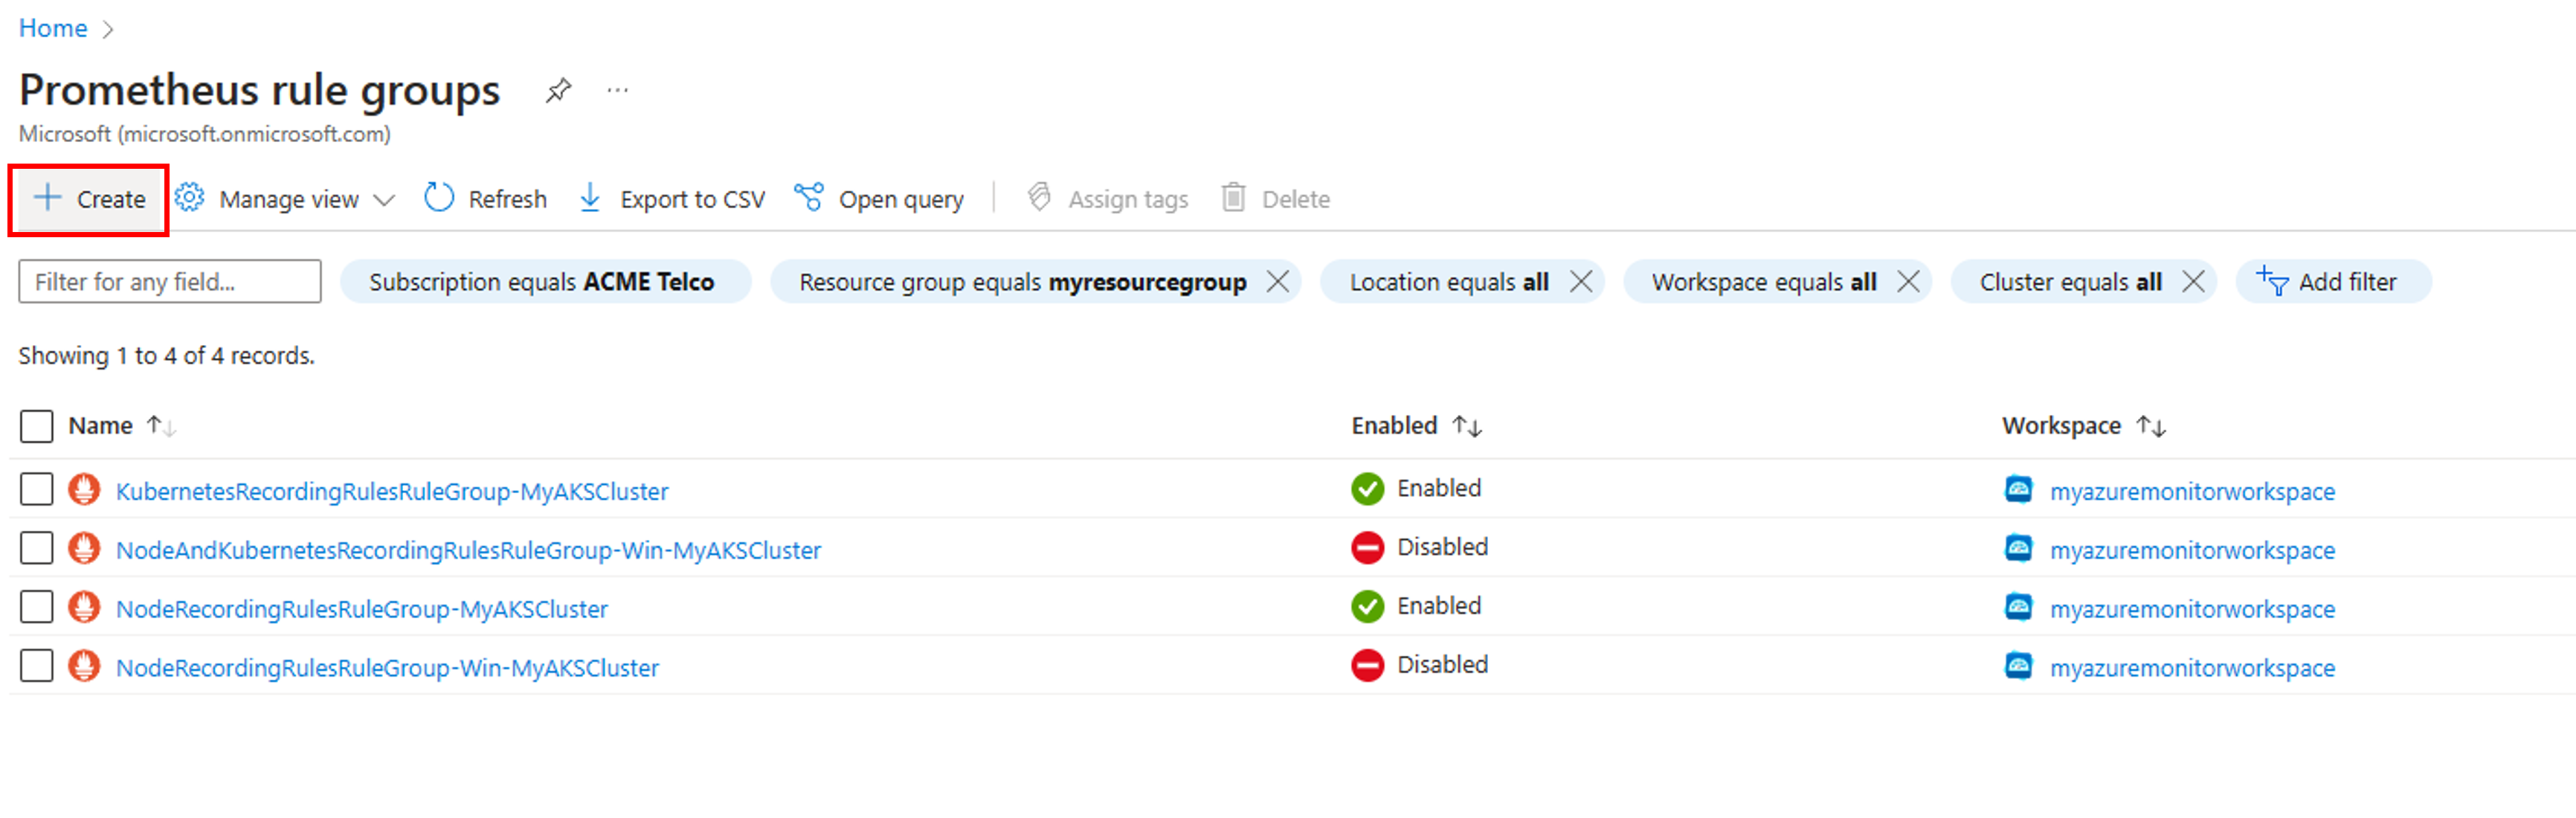
To create a new rule group from the portal home page:
To edit a new rule group from the portal home page:
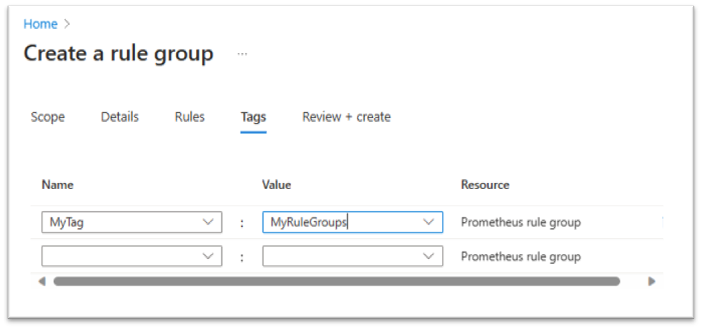
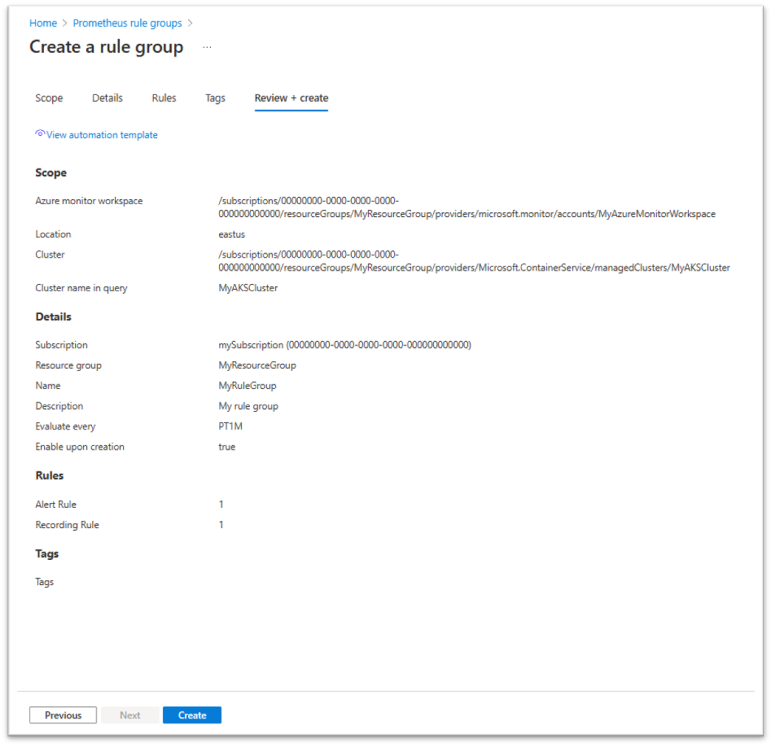
On the rule group Scope tab:
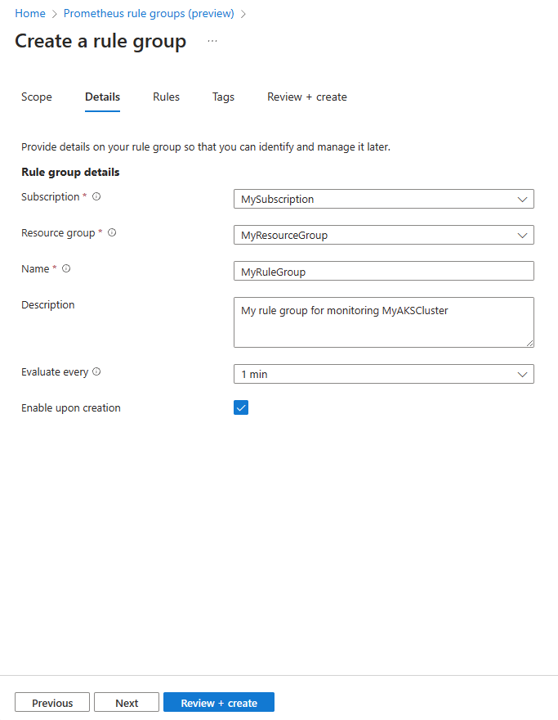
On the rule group Details tab:
On the rule group Rules tab you can see the list of recording rules and alert rules in the group.
You can add rules up to the limit of 20 rules in a single group.
Rules are evaluated in the order they appear in the group. You can change the order of rules using the move up and move down options.
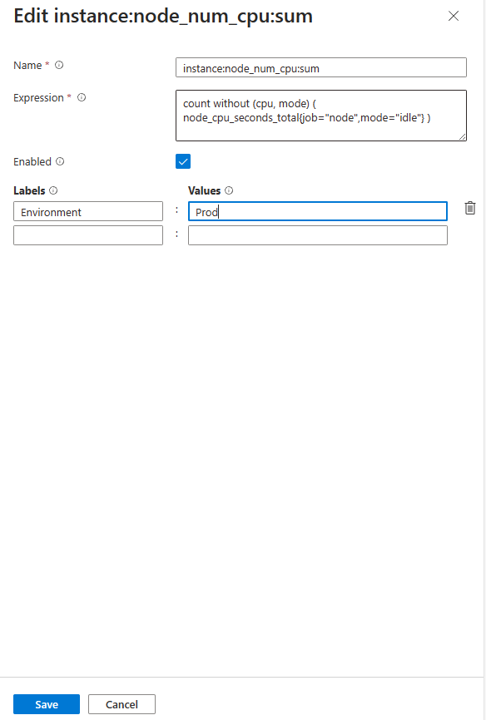
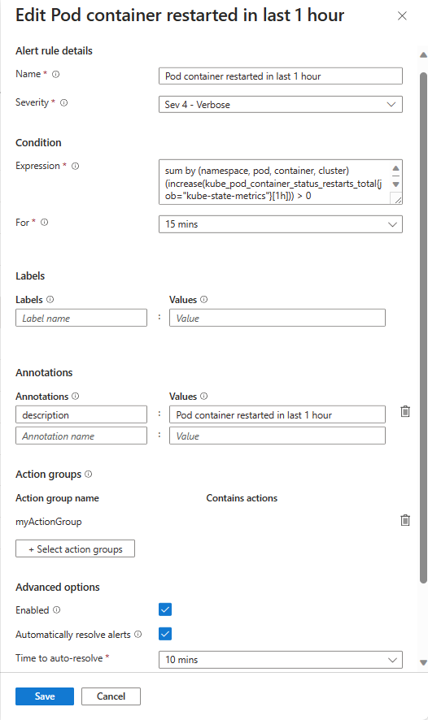
To add a new recording rule:
You can use a Resource Manager template to create and configure Prometheus rule groups, alert rules, and recording rules. Resource Manager templates enable you to programmatically create and configure rule groups in a consistent and reproducible way across all your environments.
The basic steps are as follows:
Following is a sample template that creates a Prometheus rule group, including one recording rule and one alert rule. This template creates a resource of type Microsoft.AlertsManagement/prometheusRuleGroups. The scope of this group is limited to a single AKS cluster. The rules are executed in the order they appear within a group.
{
    "$schema": "https://schema.management.azure.com/schemas/2019-04-01/deploymentTemplate.json#",
    "contentVersion": "1.0.0.0",
    "parameters": {},
    "variables": {},
    "resources": [
        {
           "name": "sampleRuleGroup",
           "type": "Microsoft.AlertsManagement/prometheusRuleGroups",
           "apiVersion": "2023-03-01",
           "location": "northcentralus",
           "properties": {
                "description": "Sample Prometheus Rule Group",
                "scopes": [
                    "/subscriptions/<subscription-id>/resourcegroups/<resource-group-name>/providers/microsoft.monitor/accounts/<azure-monitor-workspace-name>",
                    "/subscriptions/<subscription-id>/resourcegroups/<resource-group-name>/providers/microsoft.containerservice/managedclusters/<myClusterName>"
                ],
                "enabled": true,
                "clusterName": "<myCLusterName>",
                "interval": "PT1M",
                "rules": [
                    {
                        "record": "instance:node_cpu_utilisation:rate5m",
                        "expression": "1 - avg without (cpu) (sum without (mode)(rate(node_cpu_seconds_total{job=\"node\", mode=~\"idle|iowait|steal\"}[5m])))",
                        "labels": {
                            "workload_type": "job"
                        },
                        "enabled": true
                    },
                    {
                        "alert": "KubeCPUQuotaOvercommit",
                        "expression": "sum(min without(resource) (kube_resourcequota{job=\"kube-state-metrics\", type=\"hard\", resource=~\"(cpu|requests.cpu)\"})) /  sum(kube_node_status_allocatable{resource=\"cpu\", job=\"kube-state-metrics\"}) > 1.5",
                        "for": "PT5M",
                        "labels": {
                            "team": "prod"
                        },
                        "annotations": {
                            "description": "Cluster has overcommitted CPU resource requests for Namespaces.",
                            "runbook_url": "https://github.com/kubernetes-monitoring/kubernetes-mixin/tree/master/runbook.md#alert-name-kubecpuquotaovercommit",
                            "summary": "Cluster has overcommitted CPU resource requests."
                        },
                        "enabled": true,
                        "severity": 3,
                        "resolveConfiguration": {
                            "autoResolved": true,
                            "timeToResolve": "PT10M"
                        },
                        "actions": [
                            {
                               "actionGroupID": "/subscriptions/<subscription-id>/resourcegroups/<resource-group-name>/providers/microsoft.insights/actiongroups/<action-group-name>"
                            }
                        ]
                    }
                ]
            }
        }
    ]
}
The following tables describe each of the properties in the rule definition.
The rule group contains the following properties.
| Name | Required | Type | Description |
|---|---|---|---|
name |
True | string | Prometheus rule group name |
type |
True | string | Microsoft.AlertsManagement/prometheusRuleGroups |
apiVersion |
True | string | 2023-03-01 |
location |
True | string | Resource location out of supported regions. |
properties.description |
False | string | Rule group description. |
properties.scopes |
True | string[] | Must include the target Azure Monitor workspace ID. Can optionally include one more cluster ID, as well. |
properties.enabled |
False | boolean | Enable/disable group. Default is true. |
properties.clusterName |
False | string | Must match the cluster label that is added to metrics scraped from your target cluster. By default, set to the last part (resource name) of cluster ID that appears in scopes[]. |
properties.interval |
False | string | Group evaluation interval. Default = PT1M |
The rules section contains the following properties for recording rules.
| Name | Required | Type | Description |
|---|---|---|---|
record |
True | string | Recording rule name. This name is used for the new time series. |
expression |
True | string | PromQL expression to calculate the new time series value. |
labels |
True | string | Prometheus rule labels key-value pairs. These labels are added to the recorded time series. |
enabled |
False | boolean | Enable/disable group. Default is true. |
The rules section contains the following properties for alerting rules.
| Name | Required | Type | Description | Notes |
|---|---|---|---|---|
alert |
False | string | Alert rule name | |
expression |
True | string | PromQL expression to evaluate. | |
for |
False | string | Alert firing timeout. Values - PT1M, PT5M etc. | |
labels |
False | object | labels key-value pairs | Prometheus alert rule labels. These labels are added to alerts fired by this rule. |
rules.annotations |
False | object | Annotations key-value pairs to add to the alert. | |
enabled |
False | boolean | Enable/disable group. Default is true. | |
rules.severity |
False | integer | Alert severity. 0-4, default is 3 (informational) | |
rules.resolveConfigurations.autoResolved |
False | boolean | When enabled, the alert is automatically resolved when the condition is no longer true. Default = true | |
rules.resolveConfigurations.timeToResolve |
False | string | Alert auto resolution timeout. Default = "PT5M" | |
rules.action[].actionGroupId |
false | string | One or more action group resource IDs. Each is activated when an alert is fired. |
If you have a Prometheus rules configuration file (in YAML format), you can now convert it to an Azure Prometheus rule group ARM template, using the az-prom-rules-converter utility. The rules file can contain definition of one or more rule groups.
In addition to the rules file, you must provide the utility with other properties that are needed to create the Azure Prometheus rule groups, including: subscription, resource group, location, target Azure Monitor workspace, target cluster ID and name, and action groups (used for alert rules). The utility creates a template file that can be deployed directly or within a deployment pipe providing some of these properties as parameters. Properties that you provide to the utility are used for all the rule groups in the template. For example, all rule groups in the file are created in the same subscription, resource group and location, and using the same Azure Monitor workspace. If an action group is provided as a parameter to the utility, the same action group is used in all the alert rules in the template. If you want to change this default configuration (for example, use different action groups in different rules) you can edit the resulting template according to your needs, before deploying it.
Poznámka
The az-prom-convert-utility is provided as a courtesy tool. We recommend that you review the resulting template and verify it matches your intended configuration.
You can use Azure CLI to create and configure Prometheus rule groups, alert rules, and recording rules. The following code examples use Azure Cloud Shell.
In the portal, select Cloud Shell. At the prompt, use the commands that follow.
To create a Prometheus rule group, use the az alerts-management prometheus-rule-group create command. You can see detailed documentation on the Prometheus rule group create command in the az alerts-management prometheus-rule-group create section of the Azure CLI commands for creating and managing Prometheus rule groups.
Example: Create a new Prometheus rule group with rules
az alerts-management prometheus-rule-group create -n TestPrometheusRuleGroup -g TestResourceGroup -l westus --enabled --description "test" --interval PT10M --scopes "/subscriptions/aaaa0a0a-bb1b-cc2c-dd3d-eeeeee4e4e4e/resourcegroups/testrg/providers/microsoft.monitor/accounts/testaccount" --rules [{"record":"test","expression":"test","labels":{"team":"prod"}},{"alert":"Billing_Processing_Very_Slow","expression":"test","enabled":"true","severity":2,"for":"PT5M","labels":{"team":"prod"},"annotations":{"annotationName1":"annotationValue1"},"resolveConfiguration":{"autoResolved":"true","timeToResolve":"PT10M"},"actions":[{"actionGroupId":"/subscriptions/aaaa0a0a-bb1b-cc2c-dd3d-eeeeee4e4e4e/resourceGroups/testrg/providers/microsoft.insights/actionGroups/test-action-group-name1","actionProperties":{"key11":"value11","key12":"value12"}},{"actionGroupId":"/subscriptions/aaaa0a0a-bb1b-cc2c-dd3d-eeeeee4e4e4e/resourceGroups/testrg/providers/microsoft.insights/actionGroups/test-action-group-name2","actionProperties":{"key21":"value21","key22":"value22"}}]}]
To create a Prometheus rule group using PowerShell, use the new-azprometheusrulegroup cmdlet.
Example: Create Prometheus rule group definition with rules.
$rule1 = New-AzPrometheusRuleObject -Record "job_type:billing_jobs_duration_seconds:99p5m"
$action =  New-AzPrometheusRuleGroupActionObject -ActionGroupId /subscriptions/fffffffff-ffff-ffff-ffff-ffffffffffff/resourceGroups/MyresourceGroup/providers/microsoft.insights/actiongroups/MyActionGroup -ActionProperty @{"key1" = "value1"}
$Timespan = New-TimeSpan -Minutes 15
$rule2 = New-AzPrometheusRuleObject -Alert Billing_Processing_Very_Slow -Expression "job_type:billing_jobs_duration_seconds:99p5m > 30" -Enabled $false -Severity 3 -For $Timespan -Label @{"team"="prod"} -Annotation @{"annotation" = "value"} -ResolveConfigurationAutoResolved $true -ResolveConfigurationTimeToResolve $Timespan -Action $action
$rules = @($rule1, $rule2)
$scope = "/subscriptions/fffffffff-ffff-ffff-ffff-ffffffffffff/resourcegroups/MyresourceGroup/providers/microsoft.monitor/accounts/MyAccounts"
New-AzPrometheusRuleGroup -ResourceGroupName MyresourceGroup -RuleGroupName MyRuleGroup -Location eastus -Rule $rules -Scope $scope -Enabled
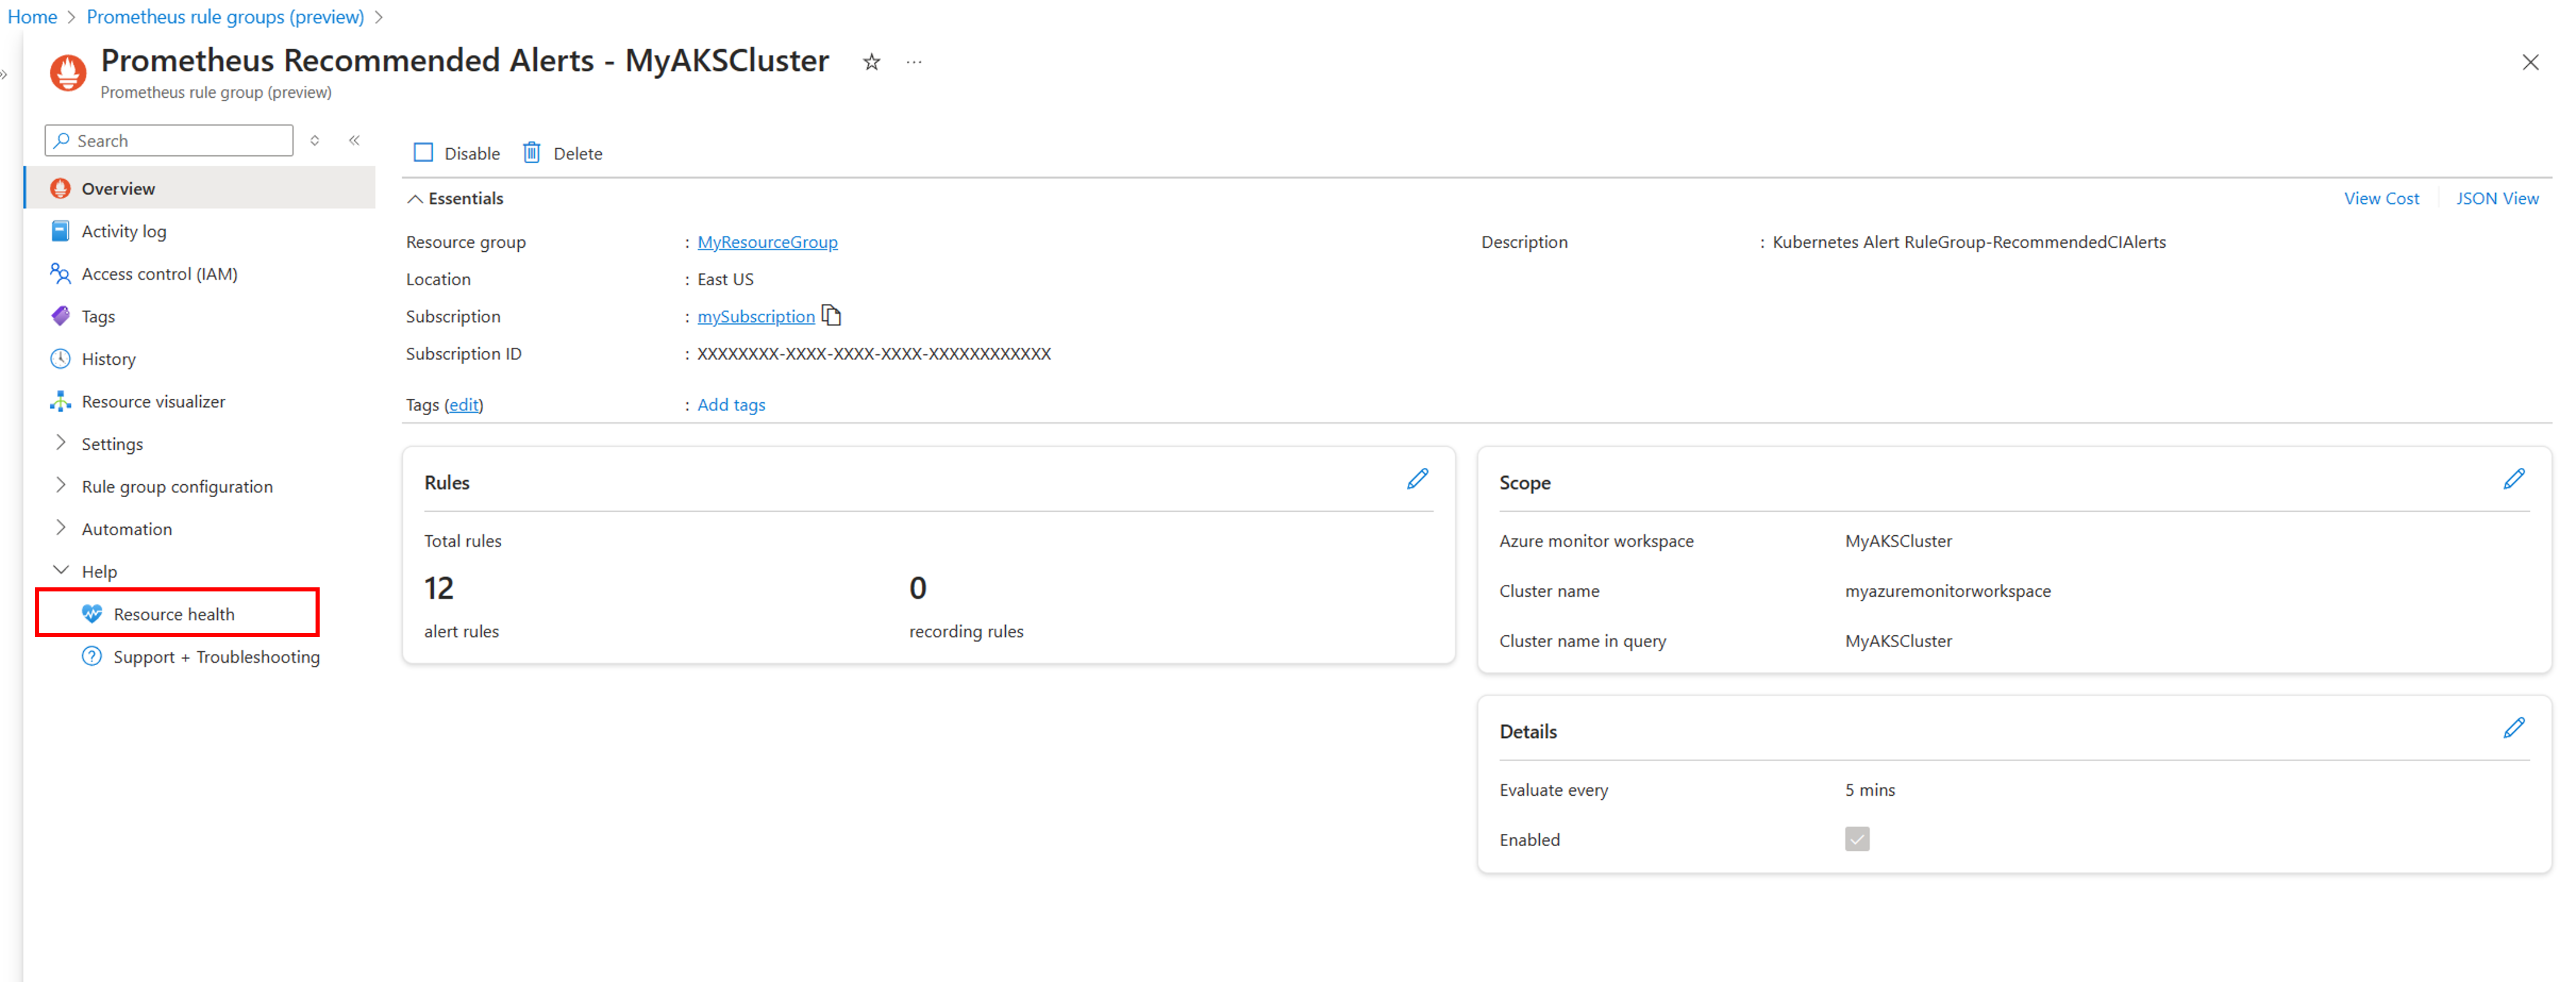
You can view your Prometheus rule groups and their included rules in the Azure portal in one of the following ways:
You can now view the resource health state of your Prometheus rule group in the portal. This can allow you to detect problems in your rule groups, such as incorrect configuration, or query throttling problems

To enable or disable a rule, select the rule group in the Azure portal. Select either Enable or Disable to change its status.
Udalosti
Vytváranie inteligentných aplikácií
17. 3., 21 - 21. 3., 10
Pripojte sa k sérii meetup a vytvorte škálovateľné riešenia AI na základe prípadov reálneho používania so spolupracovníkmi a odborníkmi.
Zaregistrovať saŠkolenie
Modul
Configure alerts and responses - Training
In this module, you learn how Azure Monitoring alerts proactively notifies you when Azure Monitor data indicates there might be a problem with your infrastructure or applications before the problem becomes one for your users.
Dokumentácia
Overview of Azure Monitor with Prometheus - Azure Monitor
Get an overview of Azure Monitor with Prometheus, which provides Prometheus-compatible interfaces called Azure Monitor workspaces for storing and retrieving metric data.
Recommended alert rules for Kubernetes clusters - Azure Monitor
Describes how to enable recommended metric alerts rules for a Kubernetes cluster in Azure Monitor.
Connect Grafana to Azure Monitor Prometheus metrics - Azure Monitor
How to configure Azure Monitor managed service for Prometheus and Azure hosted Prometheus data as data source for Azure Managed Grafana and self-managed Grafana.