Azure Synapse Analytics – Workload Management Portal Monitoring
This article explains how to monitor workload group resource utilization and query activity. For details on how to configure the Azure Metrics Explorer see the Analyze metrics with Azure Monitor metrics explorer article. See the Resource utilization section in Azure Synapse Analytics Monitoring documentation for details on how to monitor system resource consumption. There are two different categories of workload group metrics provided for monitoring workload management: resource allocation and query activity. These metrics can be split and filtered by workload group. The metrics can be split and filtered based on if they're system defined (resource class workload groups) or user-defined (created by user with CREATE WORKLOAD GROUP syntax).
Workload management metric definitions
For a description of workload management metrics, see the SQL dedicated pool - Workload management entries in Supported metrics for Microsoft.Synapse/workspaces/sqlPools.
Monitoring scenarios and actions
Below are a series of chart configurations to highlight workload management metric usage for troubleshooting along with associated actions to address the issue.
Underutilized workload isolation
Consider the following workload group and classifier configuration where a workload group named wgPriority is created and TheCEO membername is mapped to it using the wcCEOPriority workload classifier. The wgPriority workload group has 25% workload isolation configured for it (MIN_PERCENTAGE_RESOURCE = 25). Each query submitted by TheCEO is given 5% of system resources (REQUEST_MIN_RESOURCE_GRANT_PERCENT = 5).
CREATE WORKLOAD GROUP wgPriority
WITH ( MIN_PERCENTAGE_RESOURCE = 25
      ,CAP_PERCENTAGE_RESOURCE = 50
      ,REQUEST_MIN_RESOURCE_GRANT_PERCENT = 5);

CREATE WORKLOAD CLASSIFIER wcCEOPriority
WITH ( WORKLOAD_GROUP = 'wgPriority'
      ,MEMBERNAME = 'TheCEO');
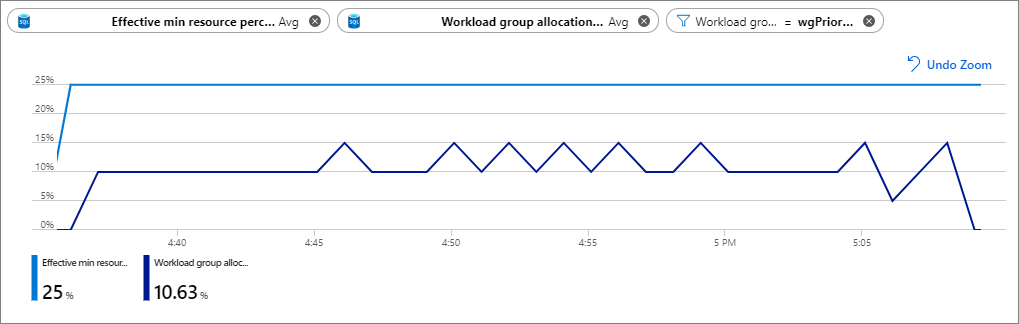
The below chart is configured as follows:
Metric 1: Effective min resource percent (Avg aggregation, blue line)
Metric 2: Workload group allocation by system percent (Avg aggregation, purple line)
Filter: [Workload Group] = wgPriority
 The chart shows that with 25% workload isolation, only 10% is being used on average. In this case, the
 MIN_PERCENTAGE_RESOURCE parameter value could be lowered to between 10 or 15 and allow for other workloads on the system to consume the resources.
Workload group bottleneck
Consider the following workload group and classifier configuration where a workload group named wgDataAnalyst is created and the DataAnalyst membername is mapped to it using the wcDataAnalyst workload classifier. The wgDataAnalyst workload group has 6% workload isolation configured for it (MIN_PERCENTAGE_RESOURCE = 6) and a resource limit of 9% (CAP_PERCENTAGE_RESOURCE = 9). Each query submitted by the DataAnalyst is given 3% of system resources (REQUEST_MIN_RESOURCE_GRANT_PERCENT = 3).
CREATE WORKLOAD GROUP wgDataAnalyst
WITH ( MIN_PERCENTAGE_RESOURCE = 6
      ,CAP_PERCENTAGE_RESOURCE = 9
      ,REQUEST_MIN_RESOURCE_GRANT_PERCENT = 3);

CREATE WORKLOAD CLASSIFIER wcDataAnalyst
WITH ( WORKLOAD_GROUP = 'wgDataAnalyst'
      ,MEMBERNAME = 'DataAnalyst');
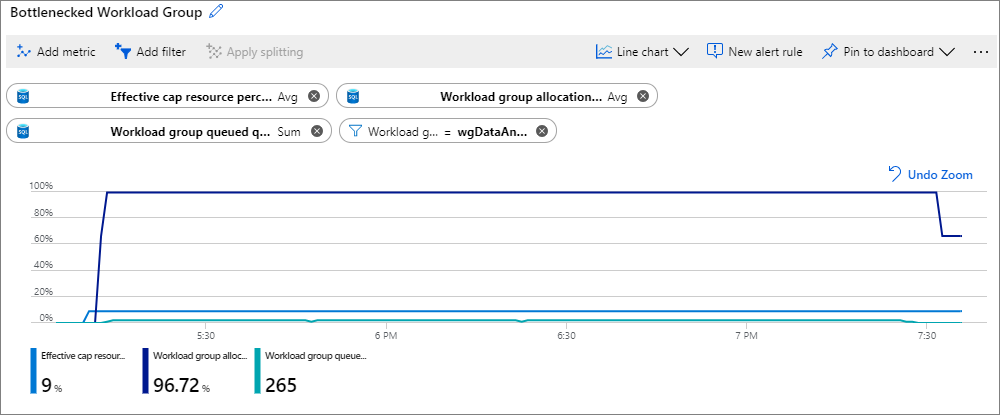
The below chart is configured as follows:
Metric 1: Effective cap resource percent (Avg aggregation, blue line)
Metric 2: Workload group allocation by cap resource percent (Avg aggregation, purple line)
Metric 3: Workload group queued queries (Sum aggregation, turquoise line)
Filter: [Workload Group] = wgDataAnalyst
 The chart shows that with a 9% cap on resources, the workload group is 90%+ utilized (from the Workload group allocation by cap resource percent metric). There's a steady queuing of queries as shown from the Workload group queued queries metric. In this case, increasing the
 CAP_PERCENTAGE_RESOURCE to a value higher than 9% allows more queries to execute concurrently. Increasing the CAP_PERCENTAGE_RESOURCE assumes that there are enough resources available and not isolated by other workload groups. Verify the cap increased by checking the Effective cap resource percent metric. If more throughput is desired, also consider increasing the REQUEST_MIN_RESOURCE_GRANT_PERCENT to a value greater than 3. Increasing the REQUEST_MIN_RESOURCE_GRANT_PERCENT could allow queries to run faster.
Next steps
Pripomienky
Pripravujeme: V priebehu roka 2024 postupne zrušíme službu Problémy v službe GitHub ako mechanizmus pripomienok týkajúcich sa obsahu a nahradíme ju novým systémom pripomienok. Ďalšie informácie nájdete na stránke: https://aka.ms/ContentUserFeedback.
Odoslať a zobraziť pripomienky pre