Model-driven charts in Power Pages
You can add a chart to a webpage by using the Liquid tag chart. As with any Liquid code, you can add the chart tag directly into the page content, embed it inside a content snippet, or add it as part of a web template.
{% chart id:"EE3C733D-5693-DE11-97D4-00155DA3B01E" viewid:"00000000-0000-0000-00AA-000010001006" %}
Two parameters are available for you to provide with the chart tag:
id- Visualization identifier of the chart. You can get this parameter by exporting the chart.viewid- Table view identifier when it's opened in the model-driven view editor. If it's not specified, the default view is used.
Showing a model-driven chart in Power Pages doesn't require any other configuration. However, configuration only supports system charts and system views.
Parameters
To obtain chart tag parameters, follow these steps.
Note
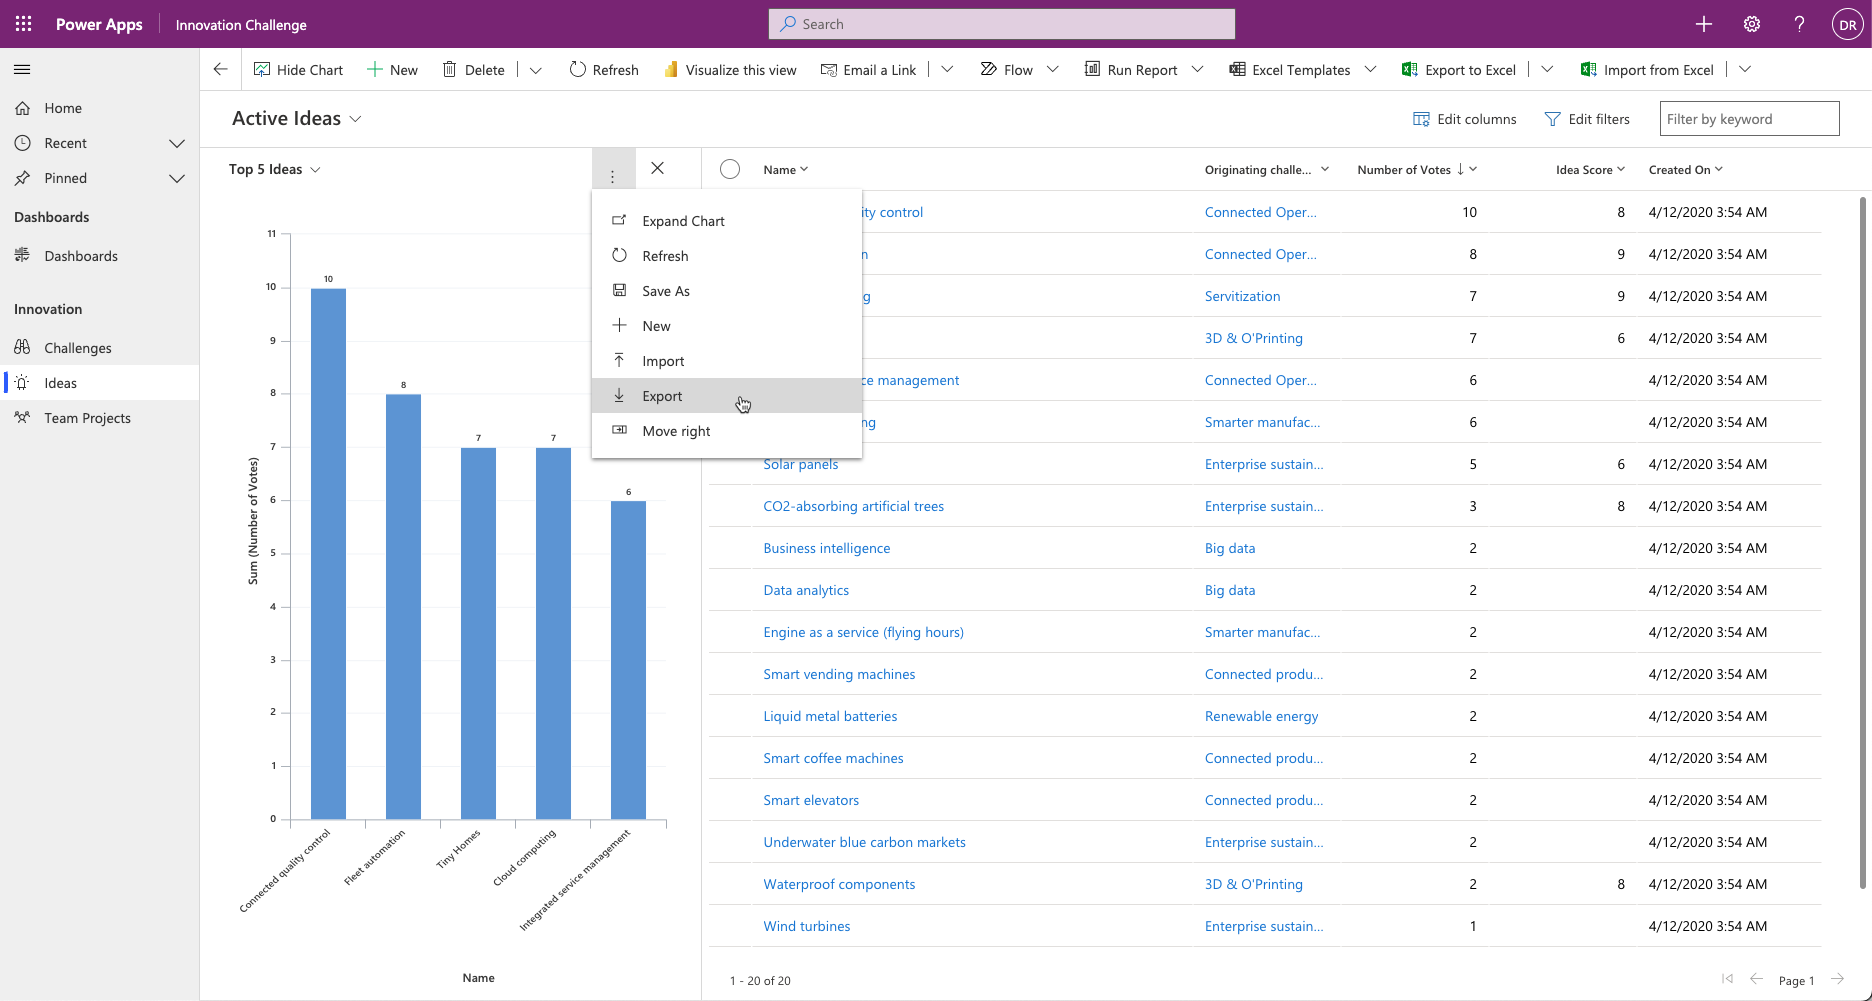
This example uses the Innovation Challenge app that's provisioned in the new Dataverse environments when the option to include sample data is selected.
Open the model-driven app that contains the chart that needs to be embedded into the webpage.
Open the view and the chart.
Locate the
viewidquery parameter in the URL, which represents the target view ID.Select the vertical ellipsis menu and then select Export.
Open the exported file in a text editor and then locate the
visualizationidelement. The content of this element is the target chart ID.Build the Liquid tag by using these parameters.
{% chart id:"d7811e72-ecff-e711-a82e-000d3a37c8e1" viewid:"445a3319-5f88-49ed-a3b5-bd741813edd3" %}You can paste this tag directly into the text element on a webpage.
To allow users to view the chart, ensure you create appropriate Table Permission records and assign applicable web roles to users to allow them to read data from the target table. If you don't grant the proper permissions, users will see an access denied message.
Note
Different users might have different resulting charts based on their specific table permissions.
Some chart types and some out-of-the-box charts aren't supported. For more information, see Unsupported charts and chart types.
For more information and step-by-step instructions, see Add a chart created in a model-driven Power App to a webpage in Power Pages.


