Manage relationship health
Do you have a good relationship with your customers? You might be surprised how your customers would answer that question. While you might think that you have a great relationship, your customers could perceive it differently. You might have a customer who feels that you only reach out during sales cycles. Or you might have a customer who sees you as someone who doesn't return calls as quickly as they would like. Those examples are only a few factors that can have a major impact on your overall relationship with your customer.
Dynamics 365 Relationship Analytics examines your entire relationship with your customers. It not only examines how often you engage with your customers, but also how your customers engage with you. Relationship Analytics looks at volumes of communications, such as the number of emails, appointments, phone calls, and other activities that you and other members of your organization initiate. Additionally, it examines other factors that can significantly affect a customer relationship, such as how often they respond to your communication and even how quickly they're responding.
Relationship Analytics provides you with an activity history overview, relationship KPIs, health score, and a health trend for contact, opportunity, lead, and account records. The KPIs that are most important, such as previous and next activities, show in the list view for each of these record types. So you can get an overview and sort the list by them.
With Relationship Analytics, your sales staff and managers are better equipped to answer questions such as:
Do we have a good relationship with the customer?
How much time have we spent with our customers?
When was the last time we contacted the customer?
When is the next time we'll contact the customer?
How many emails and meetings have we exchanged with the customer?
What is the customer's response rate?
How many activities did the customer initiate?
How long does it take our team to respond to the customer?
Which opportunities should I spend my time on?
Deal tracker
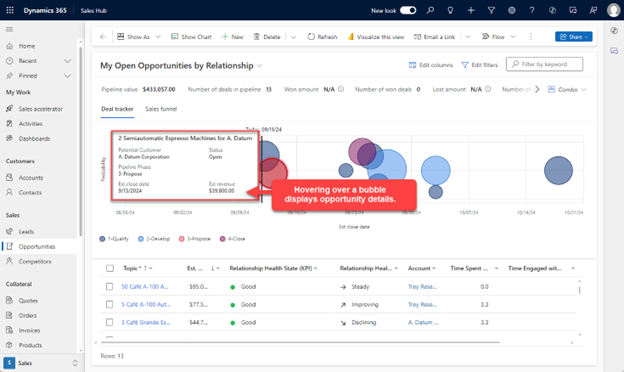
While you're working on opportunities, it can be beneficial to get a quick overview into the health of the opportunities in your pipeline. The deal tracker view provides you with a bubble chart that gives you a quick overview of the health, close date, and estimated revenue for your upcoming opportunities.
Each upcoming opportunity is plotted as a bubble on the relationship pipeline chart. The size of each bubble indicates the estimated revenue of the opportunity. Opportunities are color coded based on the Sales pipeline phase they are in.
As you hover over a bubble, you see the name of the opportunity and other details. You can open the opportunity that is associated with a bubble by selecting the bubble to open it.
The color of each bubble indicates what stage in the sales process the opportunity is in:
Dark blue indicates the opportunity is in the Qualify stage.
Light blue indicates the opportunity is in the Develop stage.
Red indicates the opportunity is in the Propose stage.
Purple indicates the opportunity is in the Close stage.
When you're viewing a customer or an opportunity record, you can see complete analytics for individual records, including:
Graphs
KPIs
Email interaction history
Full activity history
Relationship health
Summary - Displays a summary of analytics obtained from your interactions with the customer.
Relationship Health - Calculates the overall health of your relationship with the customer based on emails, appointments, phone calls and tasks associated with the record, between Dynamics 365 users and external contacts.
Customer contact interaction - Provides statistics about the customer who are most contacted by your sellers. These contacts might include Dynamics 365 users who are heavily involved with the customers even if they aren't part of the record’s users.
Your colleagues - Provides statistics about your sellers who most contacted customers. These contacts might include customers who are heavily involved with your team even if they aren't part of the record’s users.
Customer interactions - Compares the number of interactions initiated by your sellers for this opportunity to the average number of interactions for all similarly won deals.
Your hourly investment - Compares the overall number of hours spent by your sellers on emails, phone calls, meetings, and tasks for this record, to the average number of hours spent on all similar won deals.
Customer's hourly investment - Compares the overall number of hours spent by your customers on emails, phone calls, meetings, and tasks for this record to the average number of hours spent on all similar won deals.
Your email send/receive ratio - Compares the ratio of the number of emails sent by you and received by the customer in this opportunity, to the average sent and received in all similar won deals.
Customer's email send/receive ratio - Compares the ratio of the number of emails sent by the customer and received by you in this opportunity, to the average sent and received in all similar won deals.
Similar won deals - Shows top won deals that are like this opportunity. The AI model takes several characteristics and patterns such as estimated revenue, company information, etc., to determine similarity.
Relationship activities - Provides a detailed look at activities over 60 days, broken down by date and activity type such as emails sent, email received, meetings sent, meetings received, phone calls made, and phone calls received.
For more information, see Use relationship analytics to gather KPIs.

