Azure Monitor features for Kubernetes monitoring
Azure Monitor managed service for Prometheus and Container insights work together for complete monitoring of your Kubernetes environment. This article describes both features and the data they collect.
- Azure Monitor managed service for Prometheus is a fully managed service based on the Prometheus project from the Cloud Native Computing Foundation. It allows you to collect and analyze metrics from your Kubernetes cluster at scale and analyze them using prebuilt dashboards in Grafana.
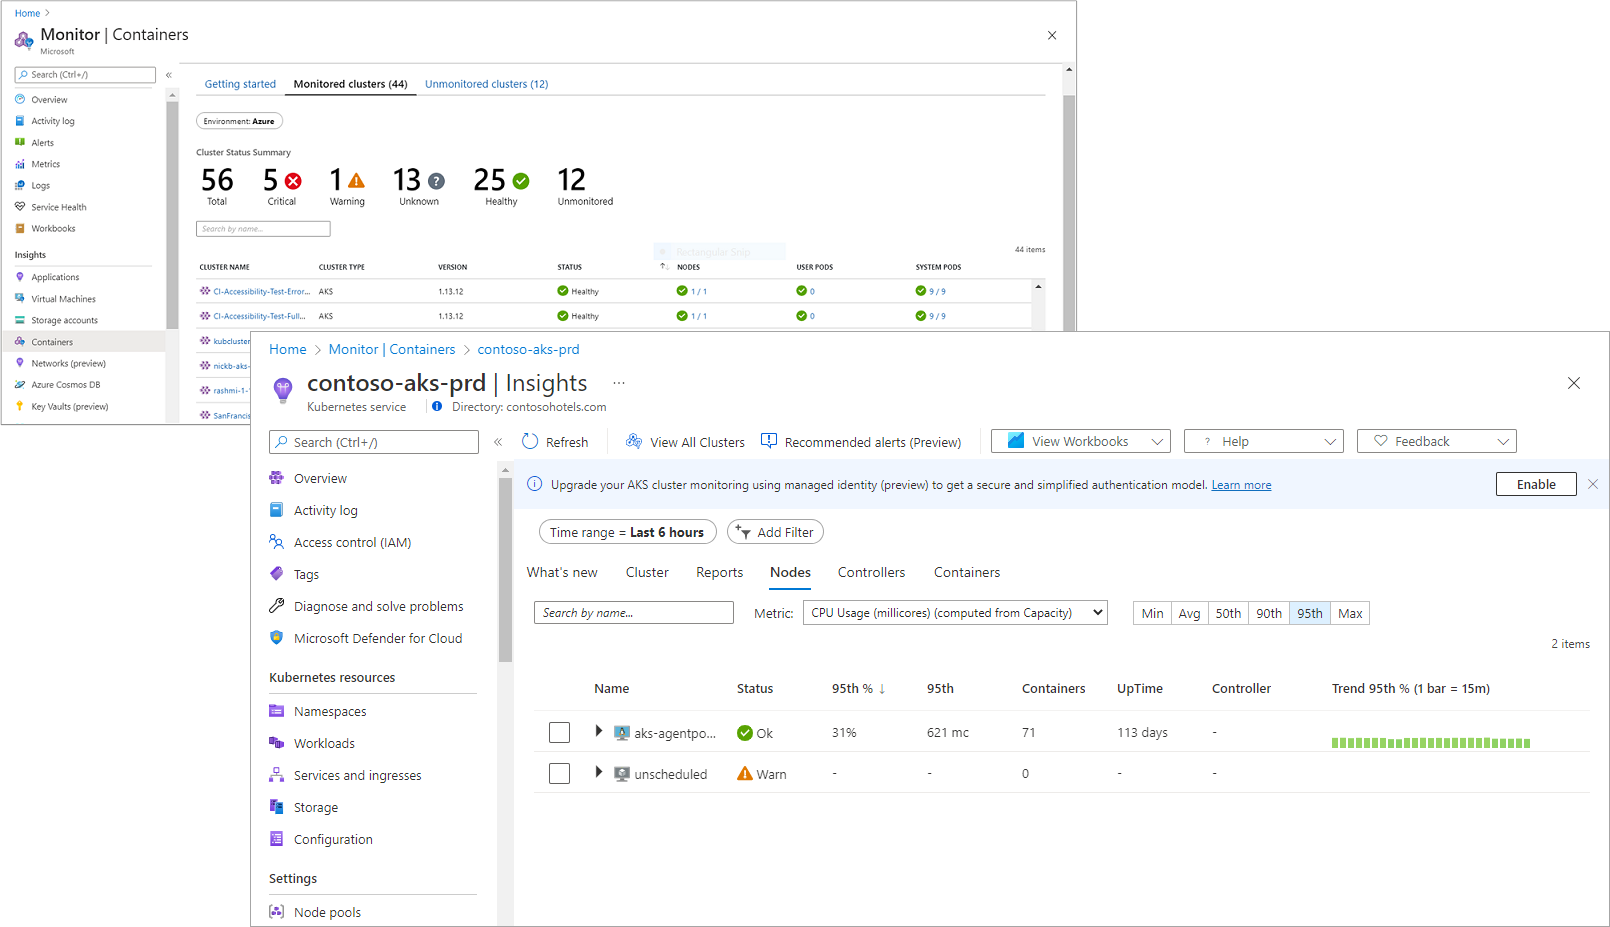
- Container insights is a feature of Azure Monitor that collects and analyzes container logs from Azure Kubernetes clusters or Azure Arc-enabled Kubernetes clusters and their components. You can analyze the collected data for the different components in your cluster with a collection of views and prebuilt workbooks.
Important
Container insights collects metric data from your cluster in addition to logs. This functionality has been replaced by Azure Monitor managed service for Prometheus. You can analyze that data using built-in dashboards in Managed Grafana and alert on them using prebuilt Prometheus alert rules.
You can continue to have Container insights collect metric data so you can use the Container insights monitoring experience. Or you can save cost by disabling this collection and using Grafana for metric analysis. See Configure data collection in Container insights using data collection rule for configuration options.
Data collected
Container insights sends data to a Log Analytics workspace where you can analyze it using different features of Azure Monitor. Managed Prometheus sends data to an Azure Monitor workspace where it can be accessed by Managed Grafana. See Monitoring data for further details on this data.
Supported configurations
Container insights supports the following environments:
- Azure Kubernetes Service (AKS)
- Following Azure Arc-enabled Kubernetes cluster distributions:
- AKS on Azure Stack HCI
- AKS Edge Essentials
- Canonical
- Cluster API Provider on Azure
- K8s on Azure Stack Edge
- Red Hat OpenShift version 4.x
- SUSE Rancher (Rancher Kubernetes engine)
- SUSE Rancher K3s
- VMware (TKG)
Note
Container insights supports ARM64 nodes on AKS. See Cluster requirements for the details of Azure Arc-enabled clusters that support ARM64 nodes.
Container insights support for Windows Server 2022 operating system is in public preview.
Security
- Container Insights supports FIPS enabled Linux and Windows node pools starting with Agent version 3.1.17 (Linux) & Win-3.1.17 (Windows).
- Starting with Agent version 3.1.17 (Linux) and Win-3.1.17 (Windows), Container Insights agents images (both Linux and Windows) are signed and for Windows agent, binaries inside the container are signed as well
Access Container insights
Access Container insights in the Azure portal from Containers in the Monitor menu or directly from the selected AKS cluster by selecting Insights. The Azure Monitor menu gives you the global perspective of all the containers that are deployed and monitored. This information allows you to search and filter across your subscriptions and resource groups. You can then drill into Container insights from the selected container. Access Container insights for a particular cluster from its page in the Azure portal.
Agent
Container insights and Managed Prometheus rely on a containerized Azure Monitor agent for Linux. This specialized agent collects performance and event data from all nodes in the cluster. The agent is deployed and registered with the specified workspaces during deployment. When you enable Container insights on a cluster, a Data collection rule (DCR) is created with the name MSCI-<cluster-region>-<cluster-name> that contains the definition of data that should be collected by Azure Monitor agent.
Since March 1, 2023 Container insights uses a semver compliant agent version. The agent version is mcr.microsoft.com/azuremonitor/containerinsights/ciprod:3.1.4 or later. When a new version of the agent is released, it will be automatically upgraded on your managed Kubernetes clusters that are hosted on AKS. To track which versions are released, see Agent release announcements.
Log Analytics agent
When Container insights doesn't use managed identity authentication, it relies on a containerized Log Analytics agent for Linux. The agent version is microsoft/oms:ciprod04202018 or later. When a new version of the agent is released, it's automatically upgraded on your managed Kubernetes clusters that are hosted on AKS. To track which versions are released, see Agent release announcements.
With the general availability of Windows Server support for AKS, an AKS cluster with Windows Server nodes has a preview agent installed as a daemon set pod on each individual Windows Server node to collect logs and forward them to Log Analytics. For performance metrics, a Linux node is automatically deployed in the cluster as part of the standard deployment collects and forwards the data to Azure Monitor for all Windows nodes in the cluster.
Frequently asked questions
This section provides answers to common questions.
Is there support for collecting Kubernetes audit logs for ARO clusters? No. Container insights don't support collection of Kubernetes audit logs.
Does Container Insights support pod sandboxing? Yes, Container Insights supports pod sandboxing through support for Kata Containers. See Pod Sandboxing (preview) with Azure Kubernetes Service (AKS).
Is it possible for a single AKS cluster to use multiple Log Analytics workspaces in Container Insights? No. Container insights only accepts one Log Analytics Workspace in Container Insights for each AKS cluster.
Next steps
- See Enable monitoring for Kubernetes clusters to enable Managed Prometheus and Container insights on your cluster.

