Visualize data in R
The R ecosystem offers multiple graphing libraries that come packed with many different features. By default, every Apache Spark Pool in Microsoft Fabric contains a set of curated and popular open-source libraries. Add or manage extra libraries or versions by using the Microsoft Fabric library management capabilities.
Prerequisites
Get a Microsoft Fabric subscription. Or, sign up for a free Microsoft Fabric trial.
Sign in to Microsoft Fabric.
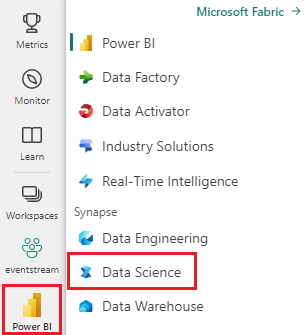
Use the experience switcher on the bottom left side of your home page to switch to Fabric.

Open or create a notebook. To learn how, see How to use Microsoft Fabric notebooks.
Set the language option to SparkR (R) to change the primary language.
Attach your notebook to a lakehouse. On the left side, select Add to add an existing lakehouse or to create a lakehouse.
ggplot2
The ggplot2 library is popular for data visualization and exploratory data analysis.

%%sparkr
library(ggplot2)
data(mpg, package="ggplot2")
theme_set(theme_bw())

g <- ggplot(mpg, aes(cty, hwy))

# Scatterplot
g + geom_point() +
  geom_smooth(method="lm", se=F) +
  labs(subtitle="mpg: city vs highway mileage",
       y="hwy",
       x="cty",
       title="Scatterplot with overlapping points",
       caption="Source: midwest")
rbokeh
rbokeh is a native R plotting library for creating interactive graphics.

library(rbokeh)
p <- figure() %>%
  ly_points(Sepal.Length, Sepal.Width, data = iris,
    color = Species, glyph = Species,
    hover = list(Sepal.Length, Sepal.Width))
p
R Plotly
Plotly is an R graphing library that makes interactive, publication-quality graphs.

library(plotly)

fig <- plot_ly() %>%
  add_lines(x = c("a","b","c"), y = c(1,3,2))%>%
  layout(title="sample figure", xaxis = list(title = 'x'), yaxis = list(title = 'y'), plot_bgcolor = "#c7daec")

fig
Highcharter
Highcharter is an R wrapper for Highcharts JavaScript library and its modules.

library(magrittr)
library(highcharter)
hchart(mtcars, "scatter", hcaes(wt, mpg, z = drat, color = hp)) %>%
  hc_title(text = "Scatter chart with size and color")