Query insights in Fabric data warehousing
Applies to: ✅ SQL analytics endpoint and Warehouse in Microsoft Fabric
In Microsoft Fabric, the query insights feature is a scalable, sustainable, and extendable solution to enhance the SQL analytics experience. With historical query data, aggregated insights, and access to actual query text, you can analyze and tune your query performance. QI provides information on queries run in a user's context only, system queries aren't considered.
The query insights feature provides a central location for historic query data and actionable insights for 30 days, helping you to make informed decisions to enhance the performance of your Warehouse or SQL analytics endpoint. When a SQL query runs in Microsoft Fabric, the query insights feature collect and consolidates its execution data, providing you with valuable information. You can view complete query text for Admin, Member, and Contributor roles.
- Historical Query Data: The query insights feature stores historical data about query executions, enabling you to track performance changes over time. System queries aren't stored in query insights.
- Aggregated Insights: The query insights feature aggregates query execution data into insights that are more actionable, such as identifying long-running queries or most active users. These aggregations are based on the query shape and is explained further in How are similar queries aggregated to generate insights?.
Before you begin
You should have access to a SQL analytics endpoint or Warehouse within a Premium capacity workspace with contributor or higher permissions.
When do you need query insights?
The query insights feature addresses several questions and concerns related to query performance and database optimization, including:
Query Performance Analysis
- What is the historical performance of our queries?
- Are there any long-running queries that need attention?
- Can we identify the queries causing performance bottlenecks?
Query Optimization and Tuning
- Which queries are frequently run, and can their performance be improved?
- Can we identify queries that have failed or been canceled?
- Can we track changes in query performance over time?
- Are there any queries that consistently perform poorly?
User Activity Monitoring
- Who submitted a particular query?
- Who are the most active users or the users with the most long-running queries?
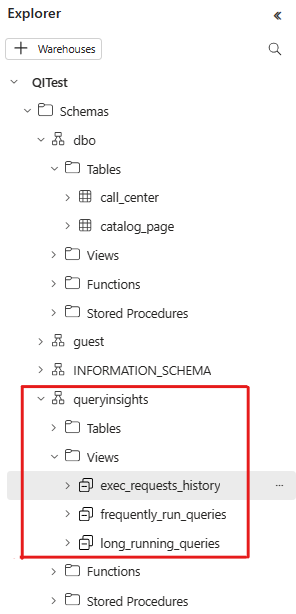
There are three system views to provide answers to these questions:
queryinsights.exec_requests_history (Transact-SQL)
- Returns information about each completed SQL request/query.
queryinsights.exec_sessions_history (Transact-SQL)
- Returns information about frequently run queries.
queryinsights.long_running_queries (Transact-SQL)
- Returns the information about queries by query execution time.
queryinsights.frequently_run_queries (Transact-SQL)
- Returns information about frequently run queries.
Where can you see query insights?
Autogenerated views are under the queryinsights schema in SQL analytics endpoint and Warehouse. In the Fabric Explorer of a Warehouse for example, find query insights views under Schemas, queryinsights, Views.

After your query completes execution, you see its execution data in the queryinsights views of the Warehouse or SQL analytics endpoint you were connected to. If you run a cross-database query while in the context of WH_2, your query appears in the query insights of WH_2. Completed queries can take up to 15 minutes to appear in query insights depending on the concurrent workload being executed. The time taken for queries to appear in query insights increases with increase in concurrent queries being executed.
How are similar queries aggregated to generate insights?
Queries are considered the same by the Query Insights if the queries have the same shape, even if the predicates may be different.
You can utilize the query hash column in the views to analyze similar queries and drill down to each execution.
For example, the following queries are considered the same after their predicates are parameterized:
SELECT * FROM Orders
WHERE OrderDate BETWEEN '1996-07-01' AND '1996-07-31';
and
SELECT * FROM Orders
WHERE OrderDate BETWEEN '2000-07-01' AND '2006-07-31';
Examples
Identify queries run by you in the last 30 minutes
The following query uses queryinsights.exec_requests_history and the built-in USER_NAME() function, which returns your current session user name.
SELECT * FROM queryinsights.exec_requests_history
WHERE start_time >= DATEADD(MINUTE, -30, GETUTCDATE())
AND login_name = USER_NAME();
Identify the most frequently run queries using a substring in the query text
The following query returns the most recent queries that match a certain string, ordered by the number of successful executions descending.
SELECT * FROM queryinsights.frequently_run_queries
WHERE last_run_command LIKE '%<some_label>%'
ORDER BY number_of_successful_runs DESC;
Identify long-running queries using a substring in the query text
The following query returns the queries that match a certain string, ordered by the median query execution time descending.
SELECT * FROM queryinsights.long_running_queries
WHERE last_run_command LIKE '%<some_label>%'
ORDER BY median_total_elapsed_time_ms DESC;