opomba,
Dostop do te strani zahteva pooblastilo. Poskusite se vpisati alispremeniti imenike.
Dostop do te strani zahteva pooblastilo. Poskusite lahko spremeniti imenike.
In Real-Time Intelligence, you can view the lineage and relationship of KQL database items. The view allows you to visually explore relationships between database entities and help you understand the data flow from the source to the destination, providing a clear graph representation. By using the entity diagram, you can efficiently manage your database and gain a deeper understanding of how these entities interact. This visual representation of entities simplifies database management and helps you optimize your data structures, making it easier to track dependencies and take actions quickly.
For information about workspace lineage in Fabric, see Lineage.
Prerequisites
- A workspace with a Microsoft Fabric-enabled capacity
- A KQL database with view permissions
For users who want to turn on the ingestion details:
- Database Admin or Database Monitor permissions to view ingestion details in the entity diagram. For more information, see Role-based access control.
Open entity diagram view
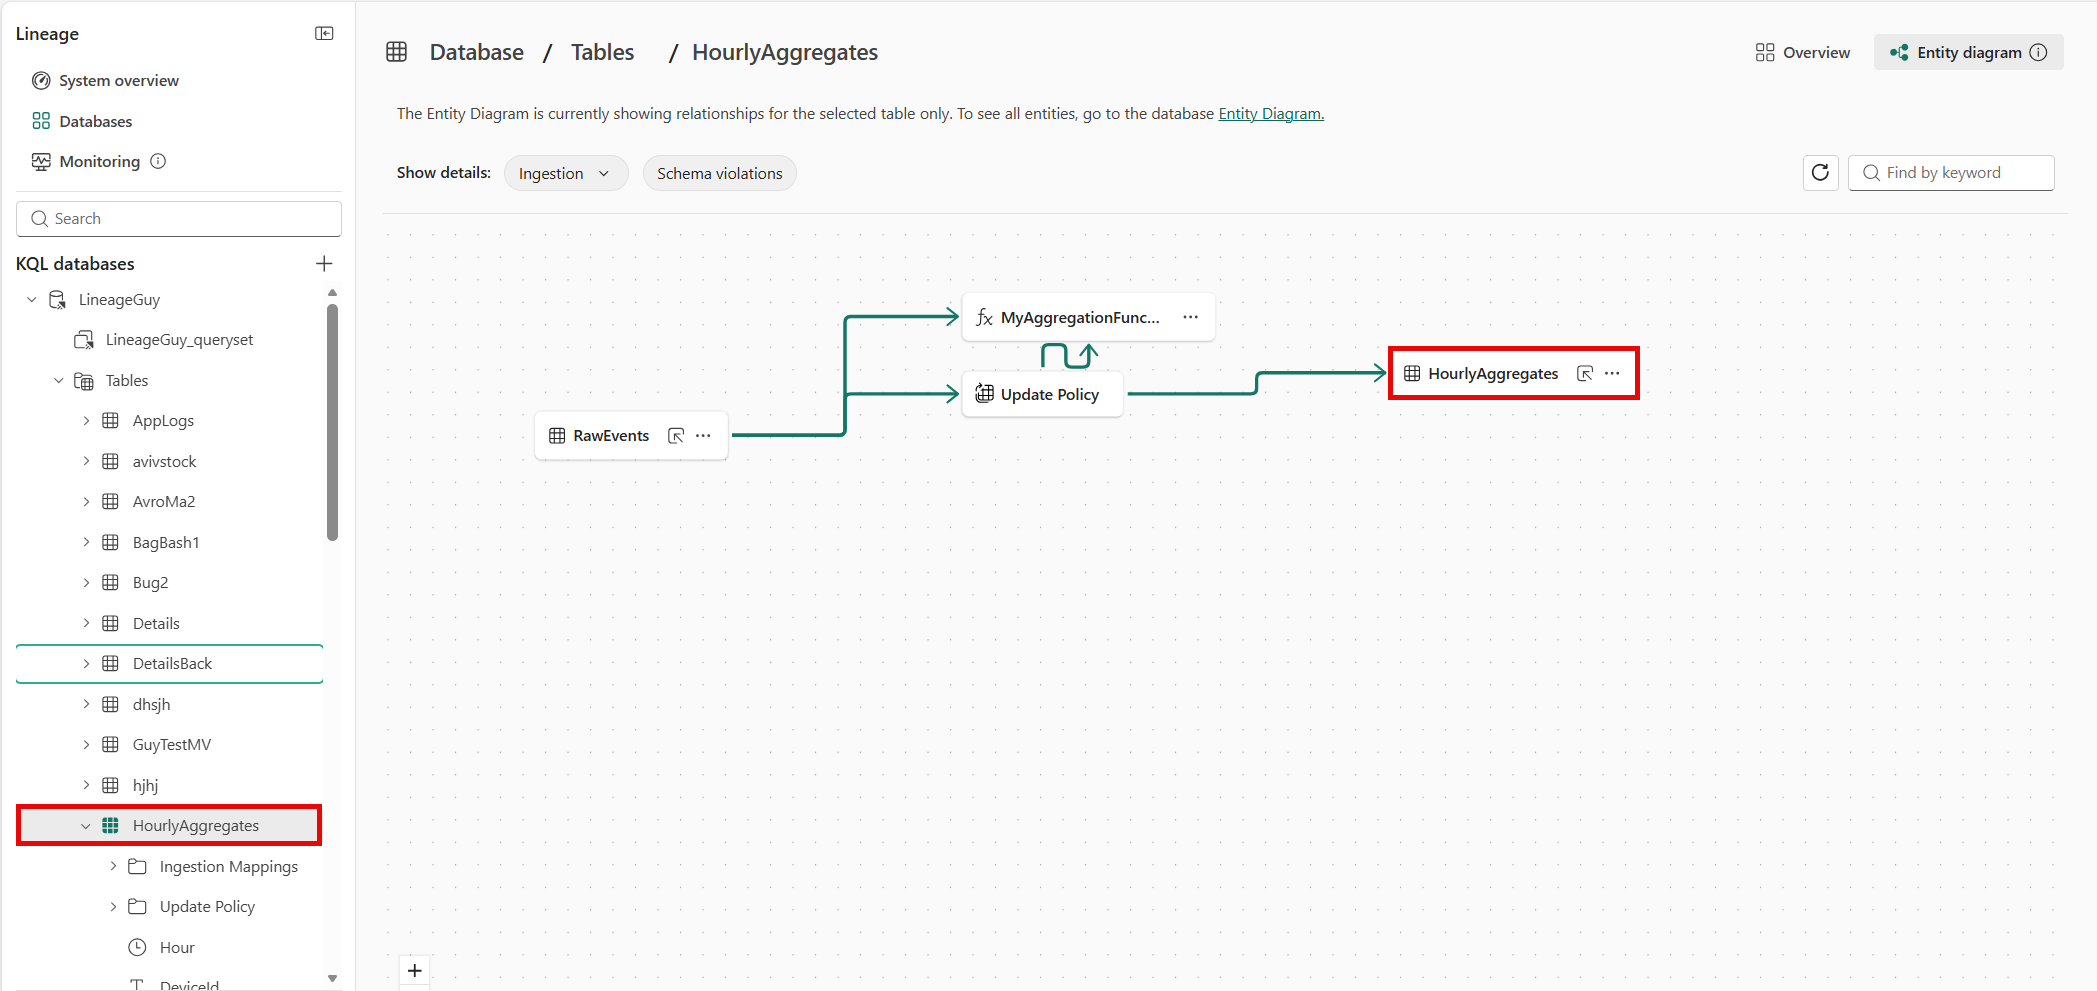
To access the view, browse to your desired KQL database and select Entity diagram.
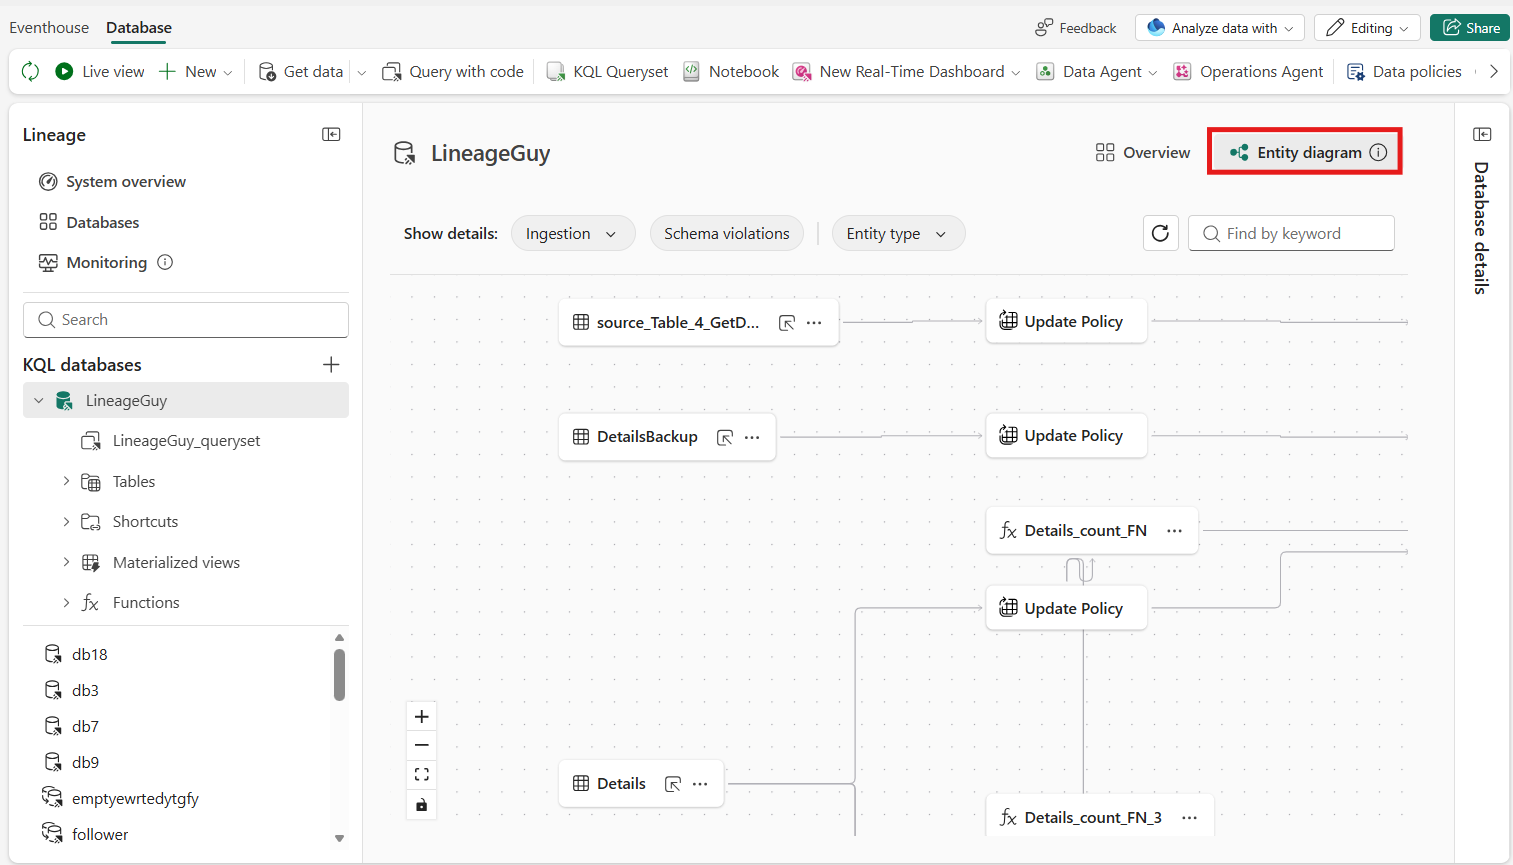
What do you see in an entity diagram view?
When you open entity diagram view, you see the dependencies between all the items in the KQL database.
The entity diagram view displays the following information:
- Tables
- Update policies
- External tables
- Shortcuts
- Materialized views
- Functions
- Continuous exports
- Cross-database entities
- Eventstreams
You can select an item to view its relationships with other items in the database. The entity diagram highlights all the items related to that item, and dims the rest.
Data sources
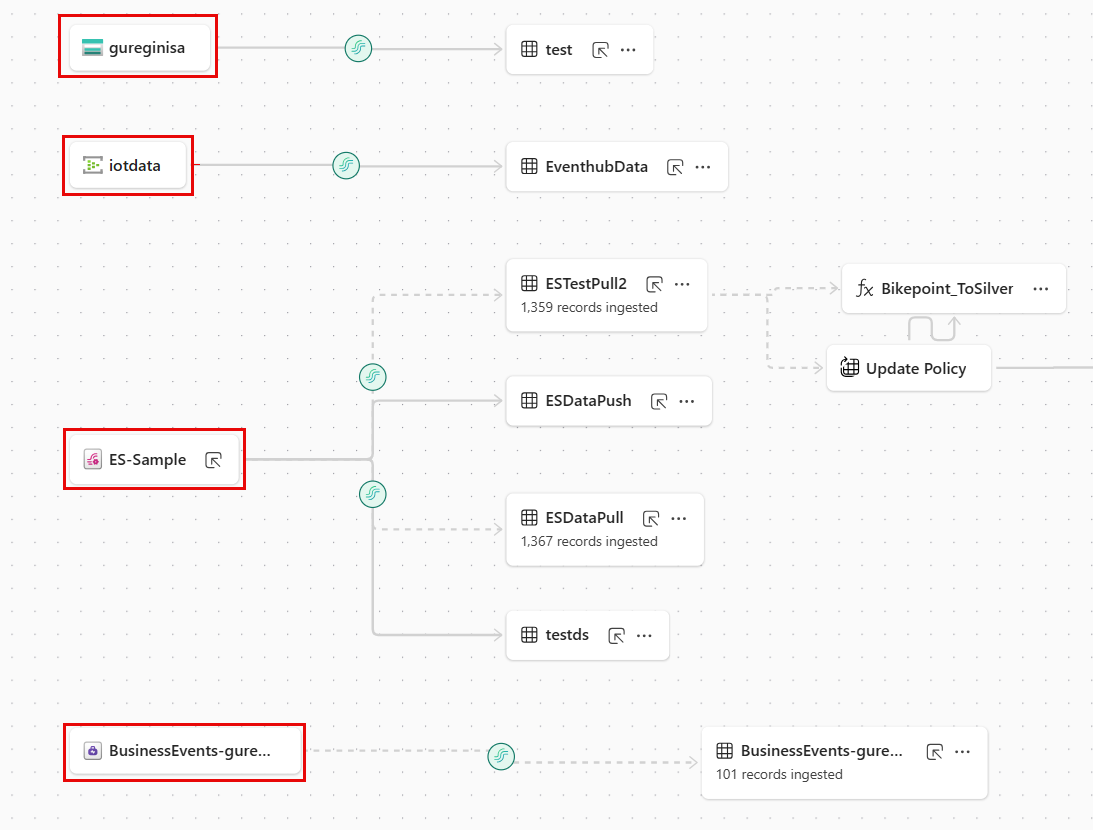
The data sources shown in the diagram include Eventstream, Azure Storage, Azure Event Hubs, and Business Events. You can now see more details about a data source, including its mapping, data format, connectivity status, and the number of records ingested. If you no longer need a connection, you can delete it directly from the entity diagram.
Note
Only Eventstreams, Event Hubs, Azure Storage Account, and Fabric Business Events appear as external sources in the entity diagram view. The entity diagram doesn't display other external sources.
Filter the entity diagram view
Filter by entity type
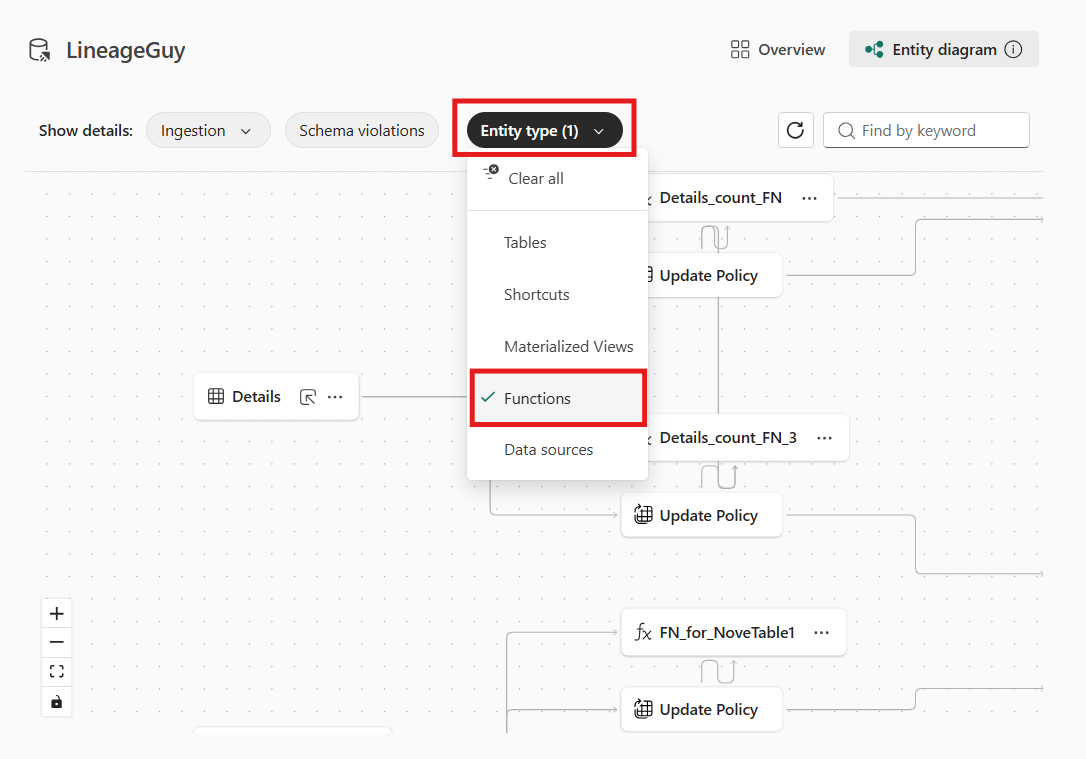
Use the Entity type dropdown filter to select the entity types you want to display in the diagram. You can choose from tables, functions, materialized view shortcuts, and data sources. This filter helps you focus on specific entity types, making it easier to analyze relationships and dependencies within your KQL database.
Filter by ingestion time range
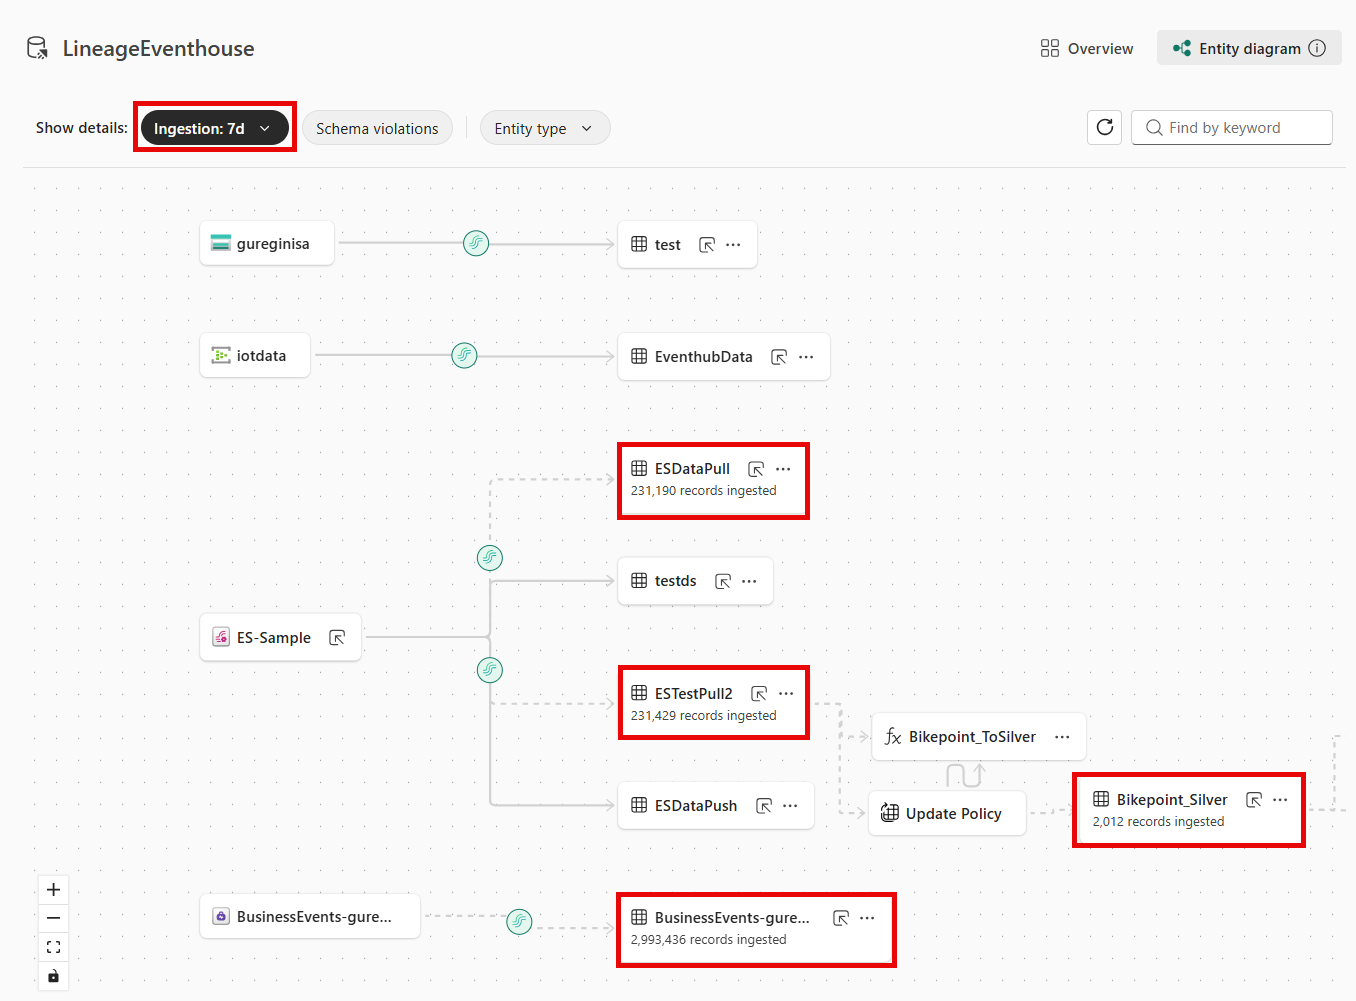
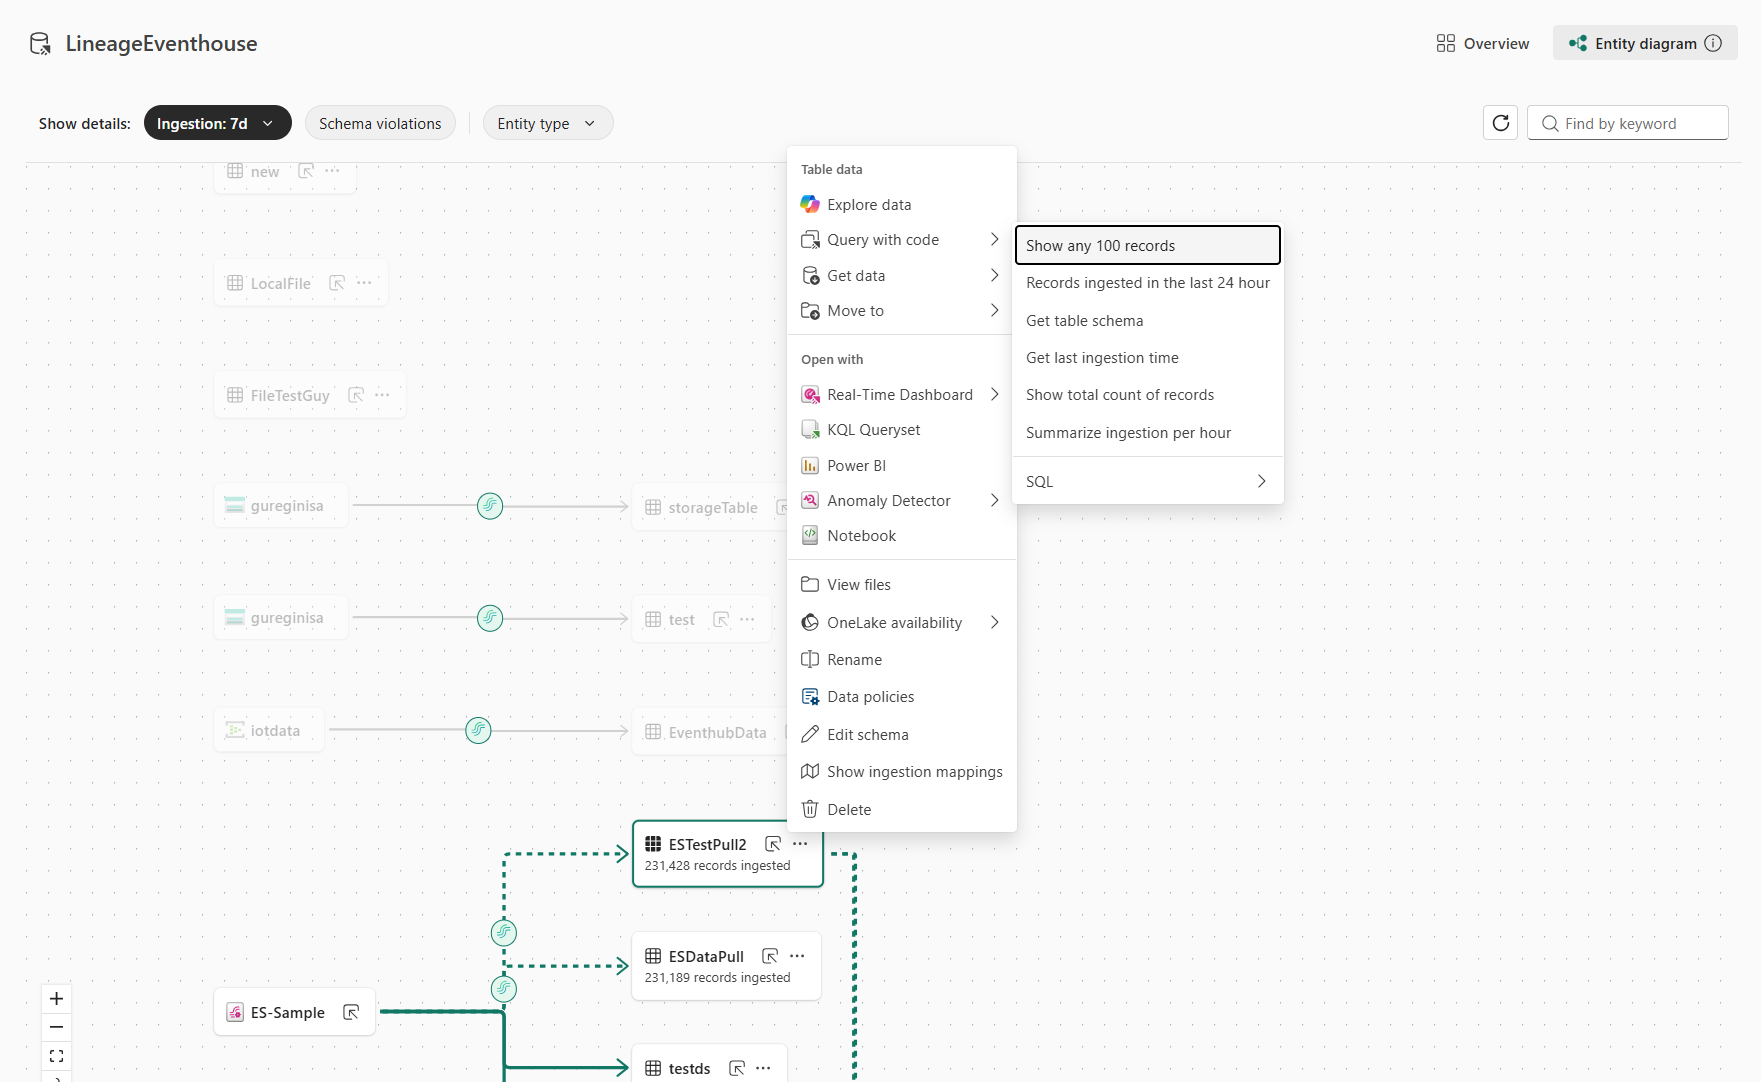
Use the Ingestion dropdown filter to select a time range for which you want to view ingestion details. This filter adds the ingestion information to the relevant entity's card in the diagram, so you can analyze data flow and ingestion patterns over time.
Filter by specific function or table
Filter the entity diagram view by selecting a specific function or table from the left navigation pane. This filter helps you focus on a particular function or table and its related entities, making it easier to analyze relationships and dependencies within your KQL database.
Schema violations
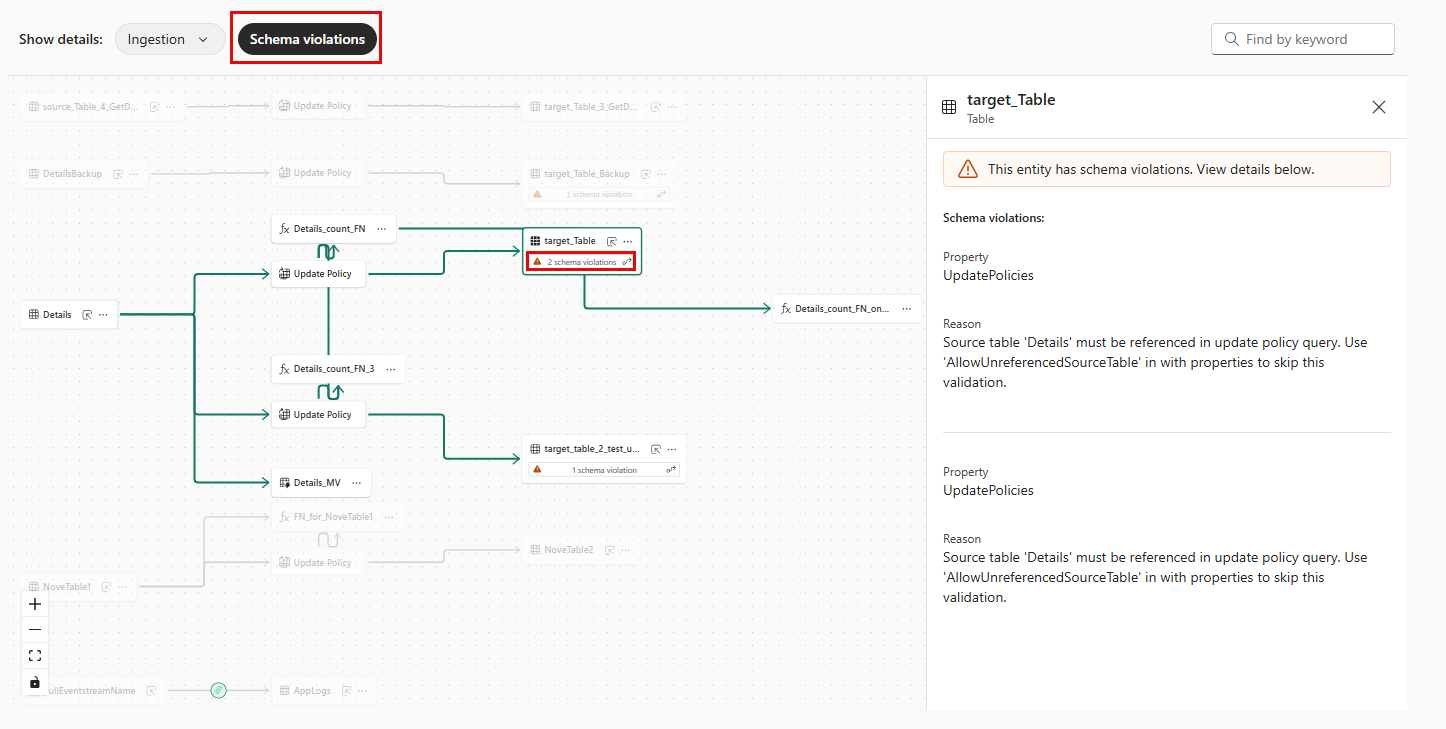
Schema violations help you identify inconsistencies or broken references between database entities. Here are some examples of schema violations:
- A function references a table or column that no longer exists.
- A function references another function that no longer exists.
- A function references a function with an incorrect number or type of parameters.
- A function references a column whose data type has changed.
- An update policy references a function or source table that no longer exists.
- An update policy references a function whose output schema doesn’t match the target table schema.
- Invalid ingestion mapping (e.g. one or more columns defined in the mapping don’t exist in the target table).
- Invalid continuous export (e.g. a referenced table or column couldn’t be found).
- An external table cannot be reached because the storage location might not exist, or there are insufficient permissions to access it.
Note
Shortcuts are referred to as "external tables" in the schema violations capability.
Enabling show Schema Violations highlights affected entities directly in the diagram. Clicking on the Schema Violation instance opens a side pane with details about the violation.
This feature allows you to quickly locate and resolve broken dependencies, ensuring your Eventhouse database remains consistent and reliable.
What scenarios can you use an entity diagrams for?
This section explores various scenarios where you can use the entity diagram view in KQL database:
Proactively manage dependencies
Managing dependencies between entities like tables and functions becomes straightforward with lineage. For example, if you rename a table or alter its schema, you can instantly identify which functions rely on that table within their KQL query. This proactive approach helps avoid unexpected issues and ensures seamless updates to your database structure.
Trace relationships between materialized views and source tables
Entity diagrams allow you to trace the relationships between materialized views and their underlying source tables. This makes it simple to identify original data sources, enabling you to track and troubleshoot data flow more effectively.
Interact with elements and act
You can select on any element in the graph to highlight its related items, while the rest of the graph is dimmed out, making it easier to focus on specific relationships. For tables and external tables, in the ellipsis [...], you can select other options, such as querying the table, creating a Power BI report based on the table, and more.
Track record ingestion
Entity diagrams enable you to track how many records were ingested into each table and materialized view. This clear view of data flows helps you stay on top of ingestion size and volume, ensuring your database processes data correctly.