Белешка
Приступ овој страници захтева ауторизацију. Можете покушати да се пријавите или промените директоријуме.
Приступ овој страници захтева ауторизацију. Можете покушати да промените директоријуме.
Learn how to create a new pipeline using Lakeflow Spark Declarative Pipelines (SDP) for data orchestration and Auto Loader. This tutorial extends the sample pipeline by cleaning the data and creating a query to find the top 100 users.
In this tutorial, you learn how to use the Lakeflow Pipelines Editor to:
- Create a new pipeline with the default folder structure and start with a set of sample files.
- Define data quality constraints using expectations.
- Use the editor features to extend the pipeline with a new transformation to perform analysis on your data.
Requirements
Before you start this tutorial, you must:
- Be logged into a Azure Databricks workspace.
- Have Unity Catalog enabled for your workspace.
- Have the Lakeflow pipelines editor enabled for your workspace and you have to be opted-in. See Enable the Lakeflow Pipelines Editor and updated monitoring.
- Have permission to create a compute resource or access to a compute resource.
- Have permissions to create a new schema in a catalog. The required permissions are
ALL PRIVILEGESorUSE CATALOGandCREATE SCHEMA.
Step 1: Create a pipeline
In this step, you create a pipeline using the default folder structure and code samples. The code samples reference the users table in the wanderbricks sample data source.
In your Azure Databricks workspace, click
 New, then
  ETL pipeline. This opens the pipeline editor, on the create a pipeline page.
Click the header to give your pipeline a name.
Just below the name, choose the default catalog and schema for your output tables. These are used when you do not specify a catalog and schema in your pipeline definitions.
Under Next step for your pipeline, click either
 Start with sample code in SQL or Start with sample code in Python, based on your language preference. This changes the default language for your sample code, but you can add code in the other language later. This creates a default folder structure with sample code to get you started.
You can view the sample code in the pipeline asset browser on the left side of the workspace. Under
transformationsare two files that generate one pipeline dataset each. Underexplorationsis a notebook that has code to help you view the output of your pipeline. Clicking a file allows you to view and edit the code in the editor.The output datasets have not yet been created, and the Pipeline graph on the right side of the screen is empty.
To run the pipeline code (the code in the
transformationsfolder), click Run pipeline in the upper right part of the screen.After the run completes, the bottom part of the workspace shows you the two new tables that were created,
sample_users_<pipeline-name>andsample_aggregation_<pipeline-name>. You can also see that the Pipeline graph on the right side of the workspace now shows the two tables, including thatsample_usersis the source forsample_aggregation.
Step 2: Apply data quality checks
In this step, you add a data quality check to the sample_users table. You use pipeline expectations to constrain the data. In this case, you delete any user records that do not have a valid email address, and output the cleaned table as users_cleaned.
In the pipeline asset browser, click
, and select Transformation.In the Create new transformation file dialog, make the following selections:
- Choose either Python or SQL for the Language. This does not have to match your previous selection.
- Give the file a name. In this case, choose
users_cleaned. - For Destination path, leave the default.
- For Dataset type, either leave it as None selected or choose Materialized view. If you select Materialized view, it generates sample code for you.
In your new code file, edit the code to match the following (use SQL or Python, based on your selection on the previous screen). Replace
<pipeline-name>with the full name for yoursample_userstable.SQL
-- Drop all rows that do not have an email address

CREATE MATERIALIZED VIEW users_cleaned
(
  CONSTRAINT non_null_email EXPECT (email IS NOT NULL) ON VIOLATION DROP ROW
) AS
SELECT *
FROM sample_users_<pipeline-name>;
Python
from pyspark import pipelines as dp

# Drop all rows that do not have an email address

@dp.table
@dp.expect_or_drop("no null emails", "email IS NOT NULL")
def users_cleaned():
    return (
        spark.read.table("sample_users_<pipeline_name>")
    )
Click Run pipeline to update the pipeline. It should now have three tables.
Step 3: Analyze top users
Next get the top 100 users by the number of bookings thay have created. Join the wanderbricks.bookings table to the users_cleaned materialized view.
In the pipeline asset browser, click
, and select Transformation.In the Create new transformation file dialog, make the following selections:
- Choose either Python or SQL for the Language. This does not have to match your previous selections.
- Give the file a name. In this case, choose
users_and_bookings. - For Destination path, leave the default.
- For Dataset type, leave it as None selected.
In your new code file, edit the code to match the following (use SQL or Python, based on your selection on the previous screen).
SQL
-- Get the top 100 users by number of bookings

CREATE OR REFRESH MATERIALIZED VIEW users_and_bookings AS
SELECT u.name AS name, COUNT(b.booking_id) AS booking_count
FROM users_cleaned u
JOIN samples.wanderbricks.bookings b ON u.user_id = b.user_id
GROUP BY u.name
ORDER BY booking_count DESC
LIMIT 100;
Python
from pyspark import pipelines as dp
from pyspark.sql.functions import col, count, desc

# Get the top 100 users by number of bookings

@dp.table
def users_and_bookings():
    return (
        spark.read.table("users_cleaned")
        .join(spark.read.table("samples.wanderbricks.bookings"), "user_id")
        .groupBy(col("name"))
        .agg(count("booking_id").alias("booking_count"))
        .orderBy(desc("booking_count"))
        .limit(100)
    )
Click Run pipeline to update the datasets. When the run is complete, you can see in the Pipeline Graph that there are four tables, including the new
users_and_bookingstable.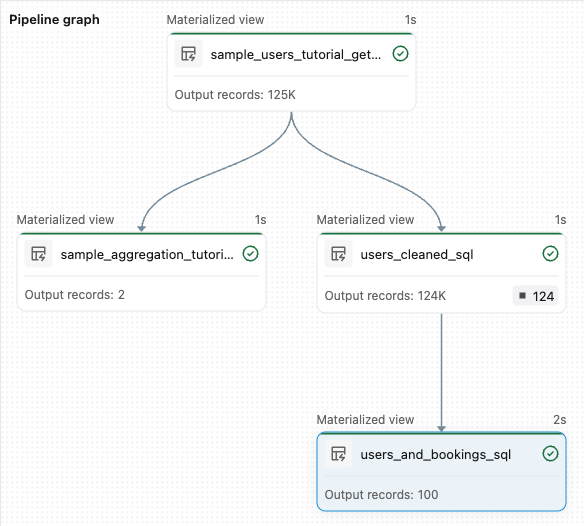
Next steps
Now that you have learned how to use some of the features of the Lakeflow pipelines editor and created a pipeline, here are some other features to learn more about:
Tools for working with and debugging transformations while creating pipelines:
- Selective execution
- Data previews
- Interactive DAG (graph of the datasets in your pipeline)
Built-in Databricks Asset Bundles integration for efficient collaboration, version control, and CI/CD integration directly from the editor: