Visualize Apache Hive data with Microsoft Power BI using ODBC in Azure HDInsight
Learn how to connect Microsoft Power BI Desktop to Azure HDInsight using ODBC and visualize Apache Hive data.
Important
You can leverage the Hive ODBC driver to do import via the generic ODBC connector in Power BI Desktop. However it is not recommended for BI workloads given non-interactive nature of the Hive query engine. HDInsight Interactive Query connector and HDInsight Spark connector are better choices for their performance.
In this article, you load the data from a hivesampletable Hive table to Power BI. The Hive table contains some mobile phone usage data. Then you plot the usage data on a world map:

The information also applies to the new Interactive Query cluster type. For how to connect to HDInsight Interactive Query using direct query, see Visualize Interactive Query Hive data with Microsoft Power BI using direct query in Azure HDInsight.
Prerequisites
Before going through this article, you must have the following items:
HDInsight cluster. The cluster can be either a HDInsight cluster with Hive or a newly released Interactive Query cluster. For creating clusters, see Create cluster.
Microsoft Power BI Desktop. You can download a copy from the Microsoft Download Center.
Create Hive ODBC data source
See Create Hive ODBC data source.
Load data from HDInsight
The hivesampletable Hive table comes with all HDInsight clusters.
Start Power BI Desktop.
From the top menu, navigate to Home > Get Data > More....

From the Get Data dialog, select Other from the left, select ODBC from the right, and then select Connect on the bottom.
From the From ODBC dialog, select the data source name you created in the last section from the drop-down list. Then select OK.
For the first use, an ODBC driver dialog will open. Select Default or Custom from the left menu. Then select Connect to open Navigator.
From the Navigator dialog, expand ODBC > HIVE > default, select hivesampletable, and then select Load.
Visualize data
Continue from the last procedure.
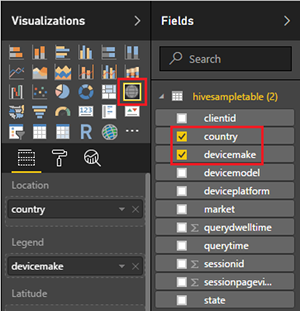
From the Visualizations pane, select Map, it's a globe icon.

From the Fields pane, select country and devicemake. You can see the data plotted on the map.
Expand the map.
Next steps
In this article, you learned how to visualize data from HDInsight using Power BI. To learn more, see the following articles: