Напомена
Приступ овој страници захтева ауторизацију. Можете покушати да се пријавите или промените директоријуме.
Приступ овој страници захтева ауторизацију. Можете покушати да промените директоријуме.
APPLIES TO: ![]() Power BI Desktop
Power BI Desktop ![]() Power BI service
Power BI service
When you're editing a report in Power BI, you can choose a column to define the sort order of another column. Here's a common example. You have a Month Name column, and when you add it to a visual, the months are being sorted alphabetically: April, August, December, February, and so on. However, you want them to be sorted chronologically. This article shows how to set the sort order of one column by a different column, in Power BI Desktop or in the Power BI service.
Note
When you're reading a report, you can also change how the values in a visual are sorted. See Change how a chart is sorted in a Power BI report for details.
Set the column to use for sorting
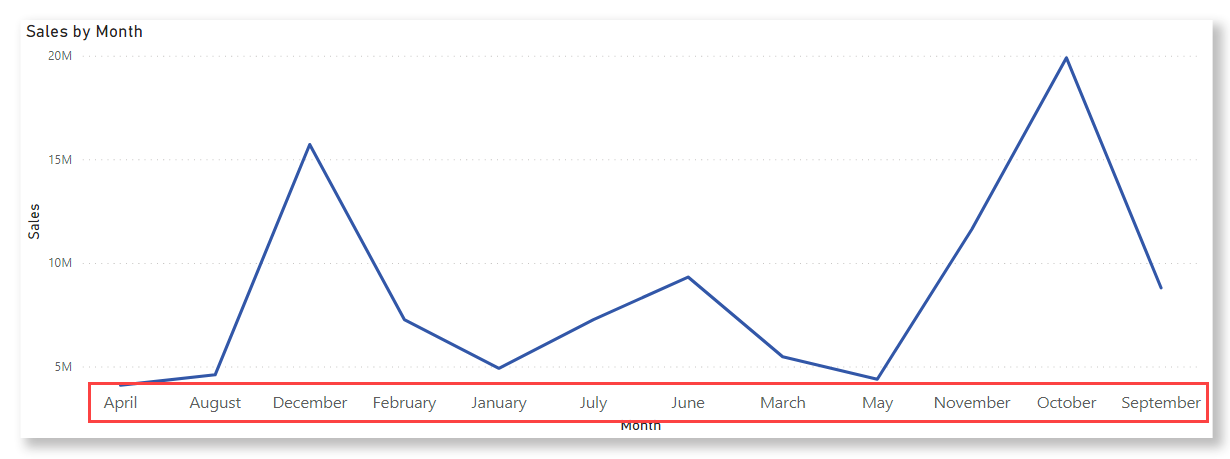
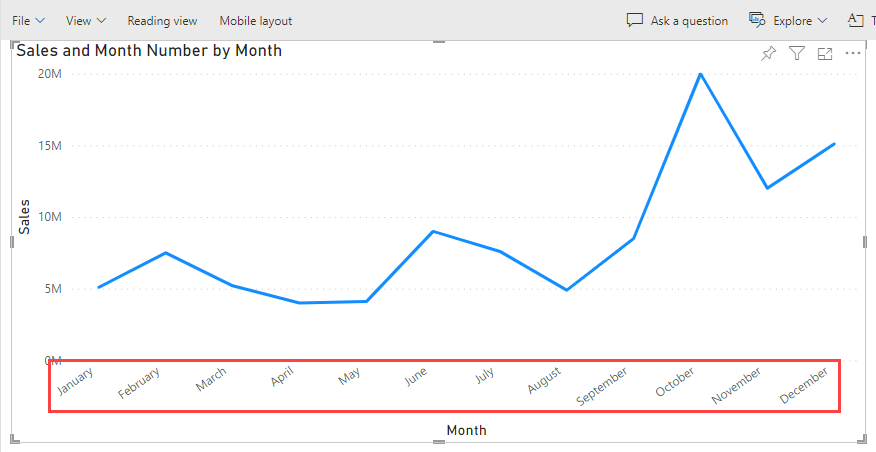
To set a different column to sort by in Power BI Desktop, both columns need to be at the same level of granularity. For example, to sort a column of month names correctly, you need a column that contains a number for each month. The sort order applies to any visual in the report that contains the sorted column. In the following example, the months are sorted alphabetically, but they should be sorted chronologically.
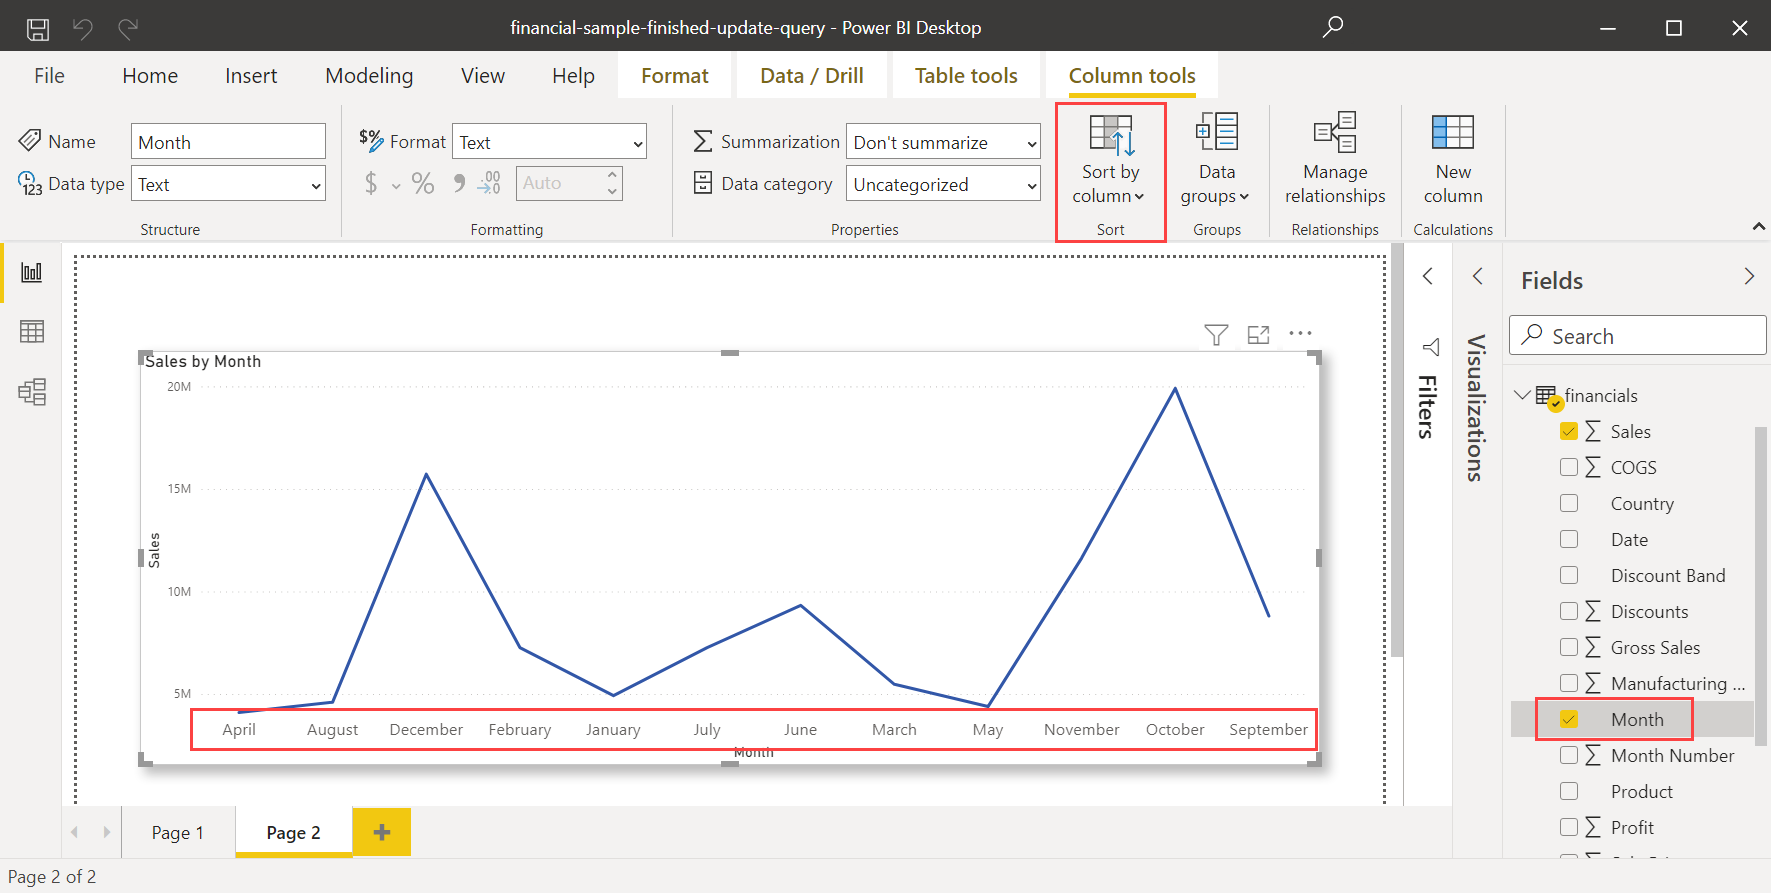
Select the column that you want to sort, in this case, Month. Months in the visual are sorted alphabetically. In the Fields pane, the Column tools tab becomes active.
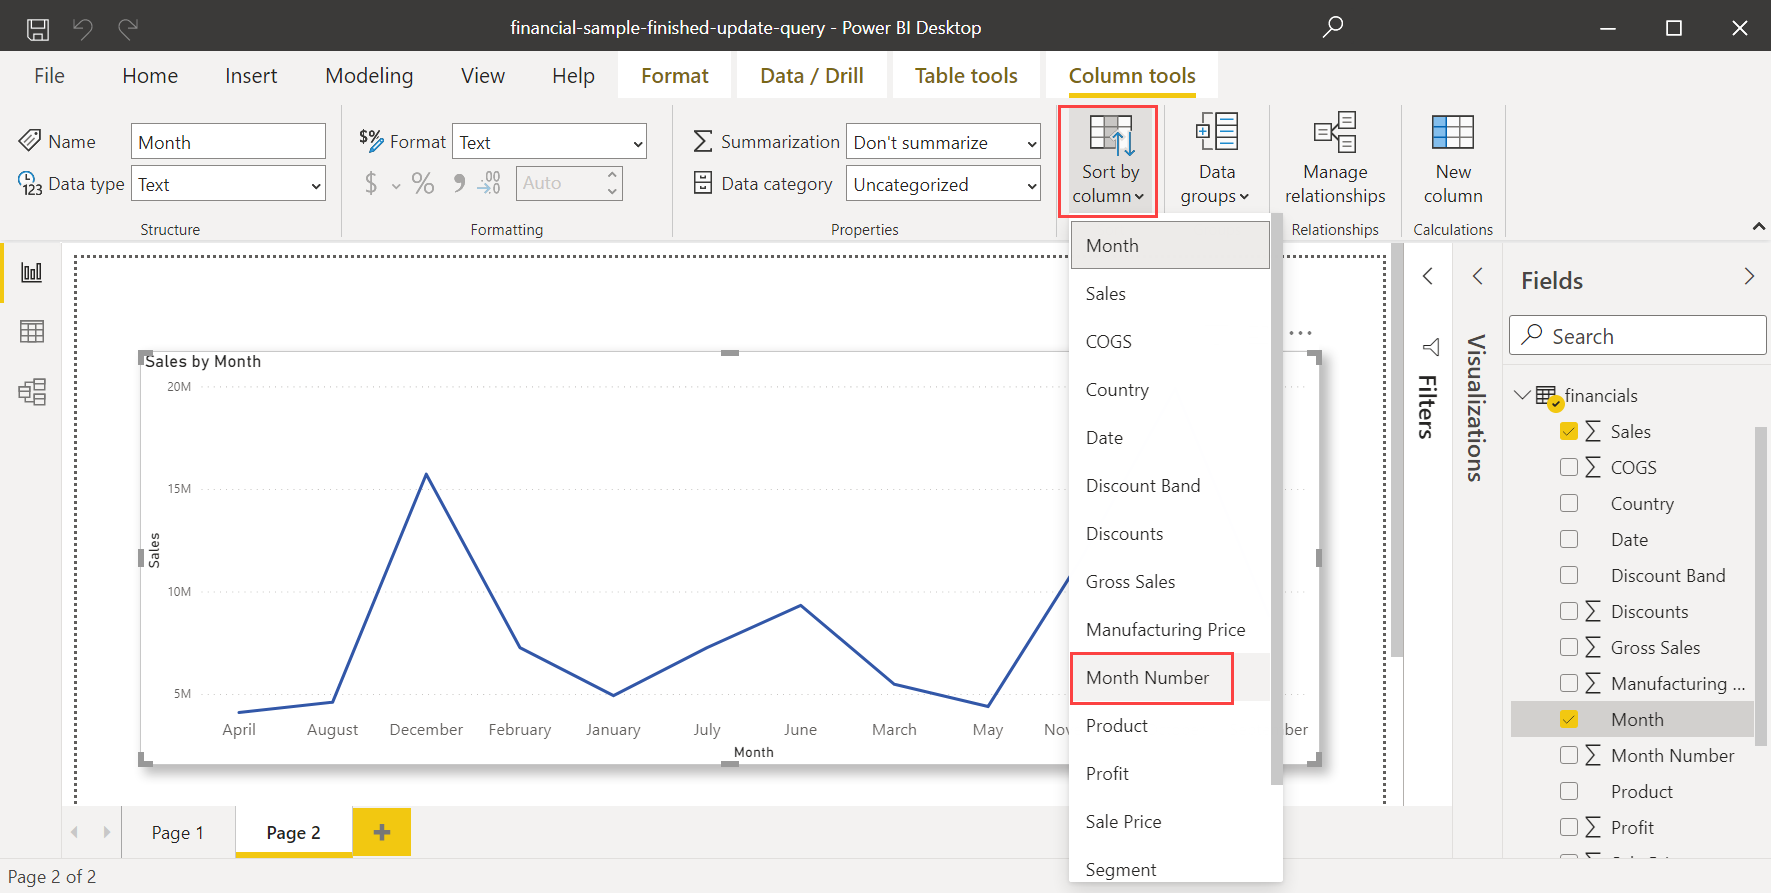
Select Sort by Column, then select the field you want to sort the other field by, in this case, Month Number.
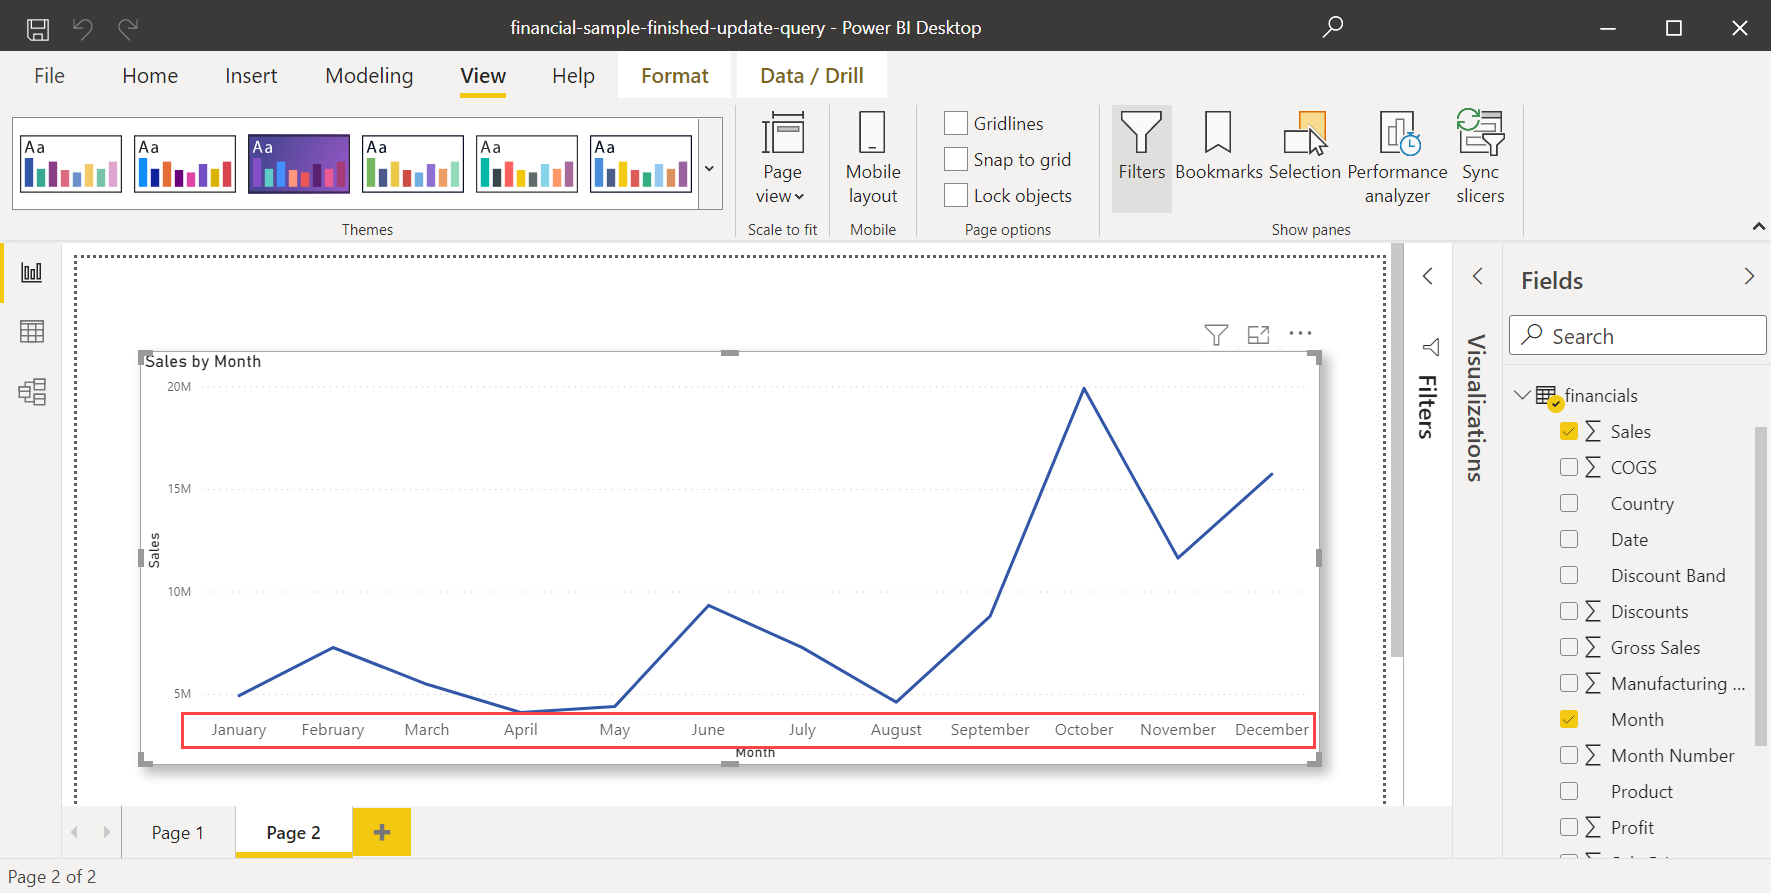
The visual automatically sorts chronologically by the order of months in a year.
Set a different column to sort
To set a different column to sort by in the Power BI service, both columns need to be at the same level of granularity. For example, to sort a column of month names, you need a column that contains a number for each month. In the following example, the months are being sorted alphabetically, but they should be sorted chronologically.
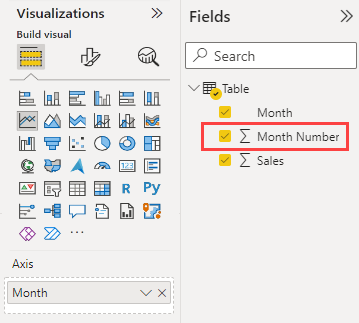
On the canvas, select the visual. Then locate the Month Number field in the Fields pane.
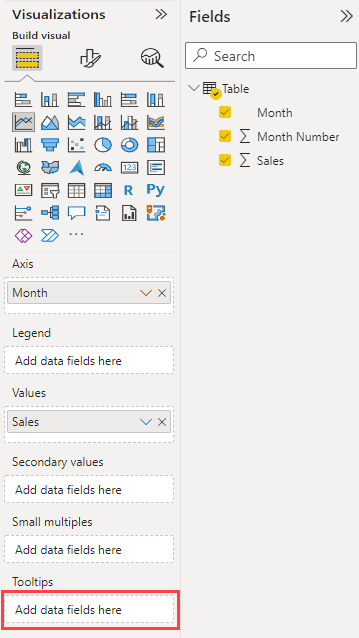
In the Visualizations pane, in the Fields section, locate the Tooltip fields bucket.
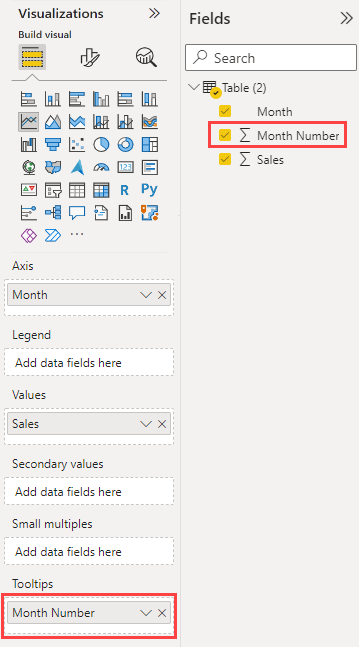
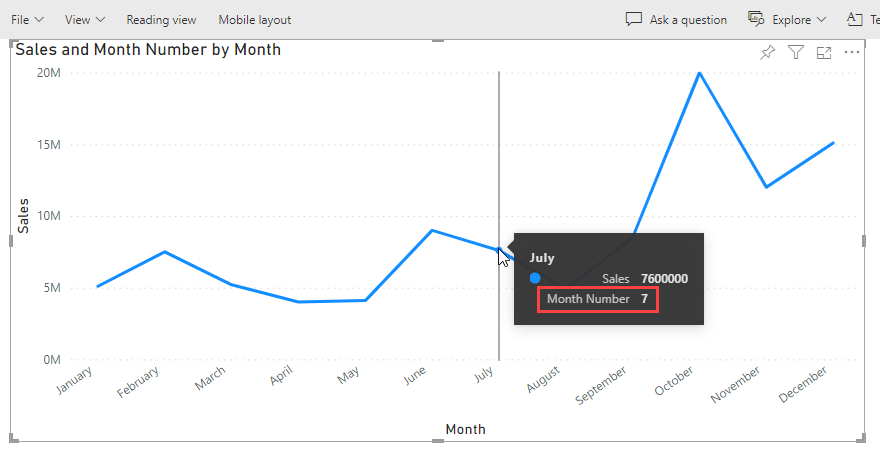
Drag the Month Number field from the Fields pane to the Tooltip fields bucket in the Visualization pane.
In the upper-right corner of the visual, select More options. Select Sort axis, and then select Month Number.
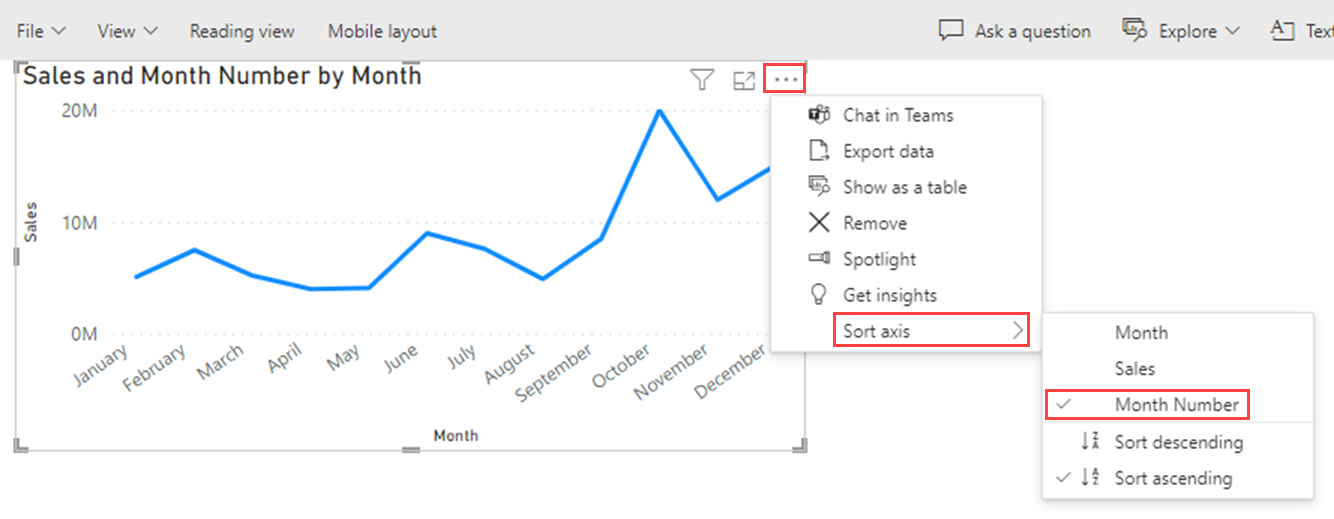
Power BI sorts the visual chronologically by the order of months in a year.
The Month Number is now visible in the visual's default tooltip.
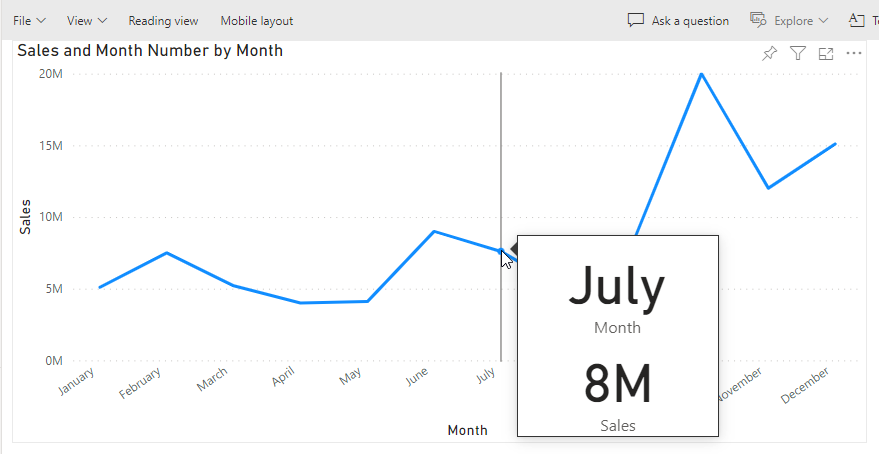
If you don't want the tooltip to contain the Month Number, use a custom tooltip that doesn't include that value. To learn how to create a custom tooltip, see Create tooltips based on report pages in Power BI Desktop.
Related content
You might also be interested in the following articles: