Monitor Azure Kubernetes Service (AKS) control plane metrics (preview)
This article shows you how to use the control plane metrics (preview) feature in Azure Kubernetes Service (AKS) to collect metrics from the control plane and view the telemetry in Azure Monitor. The control plane metrics feature is fully compatible with Prometheus and Grafana and provides more visibility into the availability and performance of the control plane components, such as the API server, ETCD, Scheduler, Autoscaler, and controller manager. You can use these metrics to maximize overall observability and maintain operational excellence for your AKS cluster.
Prerequisites and limitations
- Control plane metrics (preview) only supports Azure Monitor managed service for Prometheus.
- Private link isn't supported.
- You can only customize the default ama-metrics-settings-config-map. All other customizations aren't supported.
- The AKS cluster must use managed identity authentication.
Install or update the aks-preview Azure CLI extension
Important
AKS preview features are available on a self-service, opt-in basis. Previews are provided "as is" and "as available," and they're excluded from the service-level agreements and limited warranty. AKS previews are partially covered by customer support on a best-effort basis. As such, these features aren't meant for production use. For more information, see the following support articles:
Install or update the
aks-previewAzure CLI extension using theaz extension addoraz extension updatecommand.# Install the aks-preview extension az extension add --name aks-preview # Update the aks-preview extension az extension update --name aks-preview
Register the AzureMonitorMetricsControlPlanePreview feature flag
Register the
AzureMonitorMetricsControlPlanePreviewfeature flag using theaz feature registercommand.az feature register --namespace "Microsoft.ContainerService" --name "AzureMonitorMetricsControlPlanePreview"It takes a few minutes for the status to show Registered.
Verify the registration status using the
az feature showcommand.az feature show --namespace "Microsoft.ContainerService" --name "AzureMonitorMetricsControlPlanePreview"When the status reflects Registered, refresh the registration of the Microsoft.ContainerService resource provider using the
az provider registercommand.az provider register --namespace "Microsoft.ContainerService"
Enable control plane metrics on your AKS cluster
You can enable control plane metrics with the Azure Monitor managed service for Prometheus add-on when creating a new cluster or updating an existing cluster.
Enable control plane metrics on a new AKS cluster
To collect Prometheus metrics from your Kubernetes cluster, see Enable Prometheus and Grafana for AKS clusters and follow the steps on the CLI tab for an AKS cluster.
Enable control plane metrics on an existing AKS cluster
If your cluster already has the Prometheus add-on, update the cluster to ensure it starts collecting control plane metrics using the
az aks updatecommand.az aks update --name $CLUSTER_NAME --resource-group $RESOURCE_GROUP
Note
Unlike the metrics collected from cluster nodes, control plane metrics are collected by a component which isn't part of the ama-metrics add-on. Enabling the AzureMonitorMetricsControlPlanePreview feature flag and the managed Prometheus add-on ensures control plane metrics are collected. After enabling metric collection, it can take several minutes for the data to appear in the workspace.
Query control plane metrics
Control plane metrics are stored in an Azure Monitor workspace in the cluster's region. You can query the metrics directly from the workspace or through the Azure managed Grafana instance connected to the workspace.
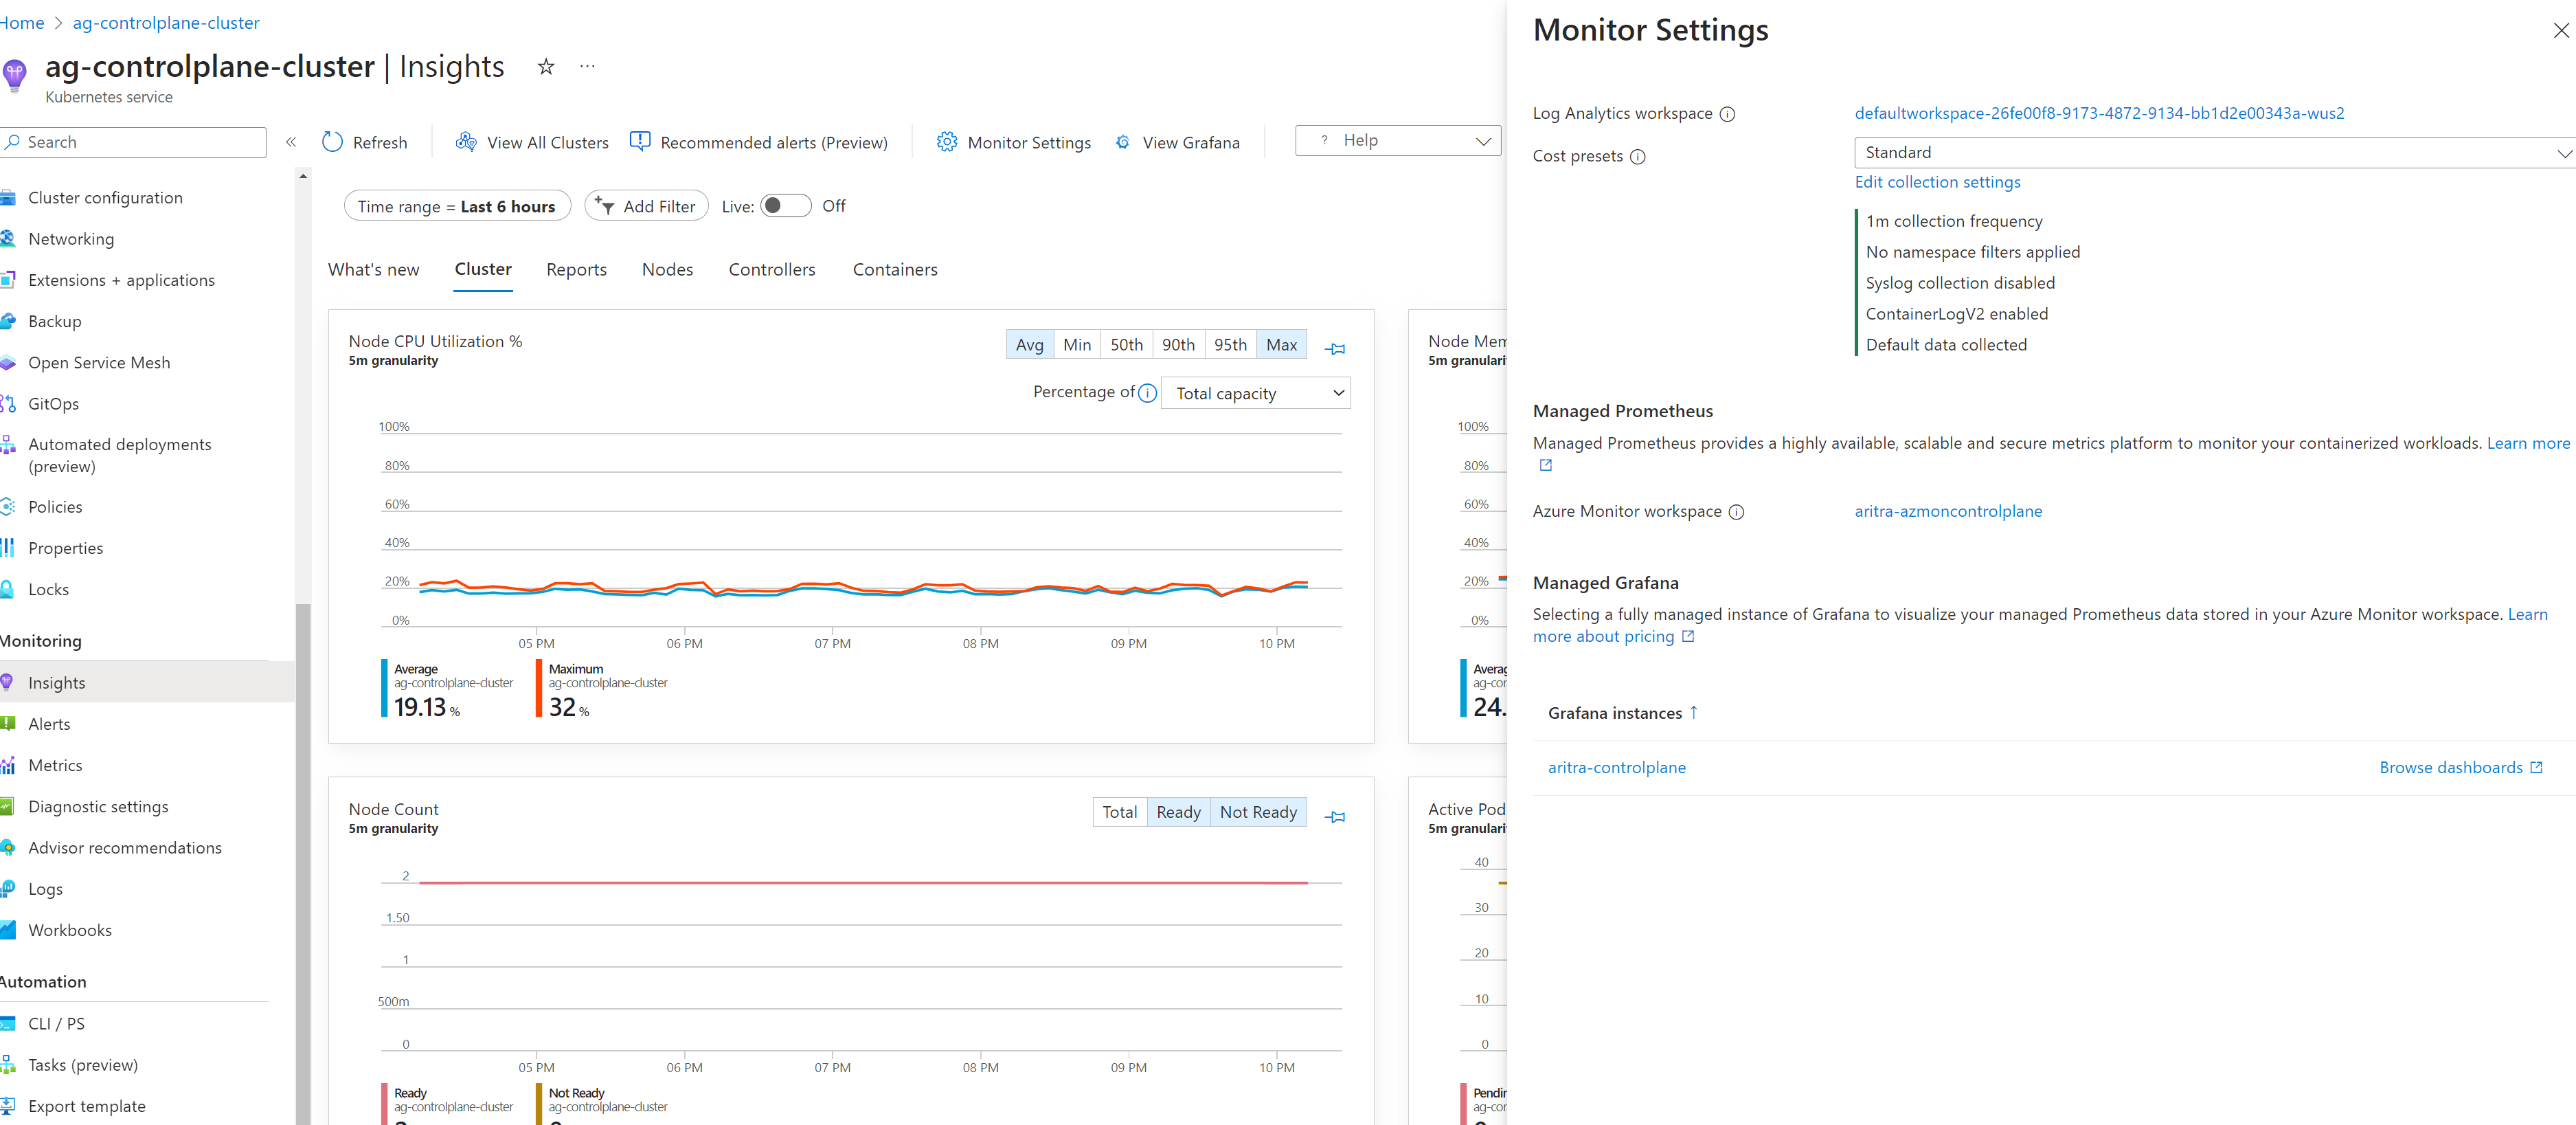
View the control plane metrics in the Azure Monitor workspace using the following steps:
In the Azure portal, navigate to your AKS cluster.
Under Monitoring, select Insights.

Note
AKS provides dashboard templates to help you view and analyze your control plane telemetry data in real-time. If you're using Azure managed Grafana to visualize the data, you can import the following dashboards:
Customize control plane metrics
AKS includes a preconfigured set of metrics to collect and store for each component. API server and etcd are enabled by default. You can customize this list through the ama-settings-configmap.
The default targets include the following:
controlplane-apiserver = true
controlplane-cluster-autoscaler = false
controlplane-kube-scheduler = false
controlplane-kube-controller-manager = false
controlplane-etcd = true
All ConfigMaps should be applied to the kube-system namespace for any cluster.
For more information about minimal-ingestion profile metrics, see Minimal ingestion profile for control plane metrics in managed Prometheus.
Ingest only minimal metrics from default targets
When setting default-targets-metrics-keep-list.minimalIngestionProfile="true", only the minimal set of metrics are ingested for each of the default targets: controlplane-apiserver and controlplane-etcd.
Ingest all metrics from all targets
Collect all metrics from all targets on the cluster using the following steps:
Download the ConfigMap file ama-metrics-settings-configmap.yaml and rename it to
configmap-controlplane.yaml.Set
minimalingestionprofile = false.Under
default-scrape-settings-enabled, verify that the targets you want to scrape are set totrue. The only targets you can specify are:controlplane-apiserver,controlplane-cluster-autoscaler,controlplane-kube-scheduler,controlplane-kube-controller-manager, andcontrolplane-etcd.Apply the ConfigMap using the
kubectl applycommand.kubectl apply -f configmap-controlplane.yamlAfter the configuration is applied, it takes several minutes before the metrics from the specified targets scraped from the control plane appear in the Azure Monitor workspace.
Ingest a few other metrics in addition to minimal metrics
The minimal ingestion profile setting helps reduce the ingestion volume of metrics, as it only collects metrics used by default dashboards, default recording rules, and default alerts are collected. To customize this setting, use the following steps:
Download the ConfigMap file ama-metrics-settings-configmap and rename it to
configmap-controlplane.yaml.Set
minimalingestionprofile = true.Under
default-scrape-settings-enabled, verify that the targets you want to scrape are set totrue. The only targets you can specify are:controlplane-apiserver,controlplane-cluster-autoscaler,controlplane-kube-scheduler,controlplane-kube-controller-manager, andcontrolplane-etcd.Under
default-targets-metrics-keep-list, specify the list of metrics for thetruetargets. For example:controlplane-apiserver= "apiserver_admission_webhook_admission_duration_seconds| apiserver_longrunning_requests"Apply the ConfigMap using the
kubectl applycommand.kubectl apply -f configmap-controlplane.yamlAfter the configuration is applied, it takes several minutes before the metrics from the specified targets scraped from the control plane appear in the Azure Monitor workspace.
Ingest only specific metrics from some targets
Download the ConfigMap file ama-metrics-settings-configmap and rename it to
configmap-controlplane.yaml.Set
minimalingestionprofile = false.Under
default-scrape-settings-enabled, verify that the targets you want to scrape are set totrue. The only targets you can specify here arecontrolplane-apiserver,controlplane-cluster-autoscaler,controlplane-kube-scheduler,controlplane-kube-controller-manager, andcontrolplane-etcd.Under
default-targets-metrics-keep-list, specify the list of metrics for thetruetargets. For example:controlplane-apiserver= "apiserver_admission_webhook_admission_duration_seconds| apiserver_longrunning_requests"Apply the ConfigMap using the
kubectl applycommand.kubectl apply -f configmap-controlplane.yamlAfter the configuration is applied, it takes several minutes before the metrics from the specified targets scraped from the control plane appear in the Azure Monitor workspace.
Troubleshoot control plane metrics issues
Make sure the feature flag AzureMonitorMetricsControlPlanePreview is enabled and the ama-metrics pods are running.
Note
The troubleshooting methods for Azure managed service Prometheus don't directly translate here, as the components scraping the control plane aren't present in the managed Prometheus add-on.
ConfigMap formatting
Make sure you're using proper formatting in the ConfigMap and that the fields, specifically default-targets-metrics-keep-list, minimal-ingestion-profile, and default-scrape-settings-enabled, are correctly populated with their intended values.
Isolate control plane from data plane
Start by setting some of the node related metrics to true and verify the metrics are being forwarded to the workspace. This helps determine if the issue is specific to scraping control plane metrics.
Events ingested
Once you applied the changes, you can open metrics explorer from the Azure Monitor overview page or from the Monitoring section the selected cluster and check for an increase or decrease in the number of events ingested per minute. It should help you determine if a specific metric is missing or if all metrics are missing.
Specific metric isn't exposed
There have been cases where metrics are documented, but aren't exposed from the target and aren't forwarded to the Azure Monitor workspace. In this case, it's necessary to verify other metrics are being forwarded to the workspace.
No access to the Azure Monitor workspace
When you enable the add-on, you might have specified an existing workspace that you don't have access to. In that case, it might look like the metrics aren't being collected and forwarded. Make sure that you create a new workspace while enabling the add-on or while creating the cluster.
Disable control plane metrics on your AKS cluster
You can disable control plane metrics at any time by disabling the managed Prometheus add-on and unregistering the AzureMonitorMetricsControlPlanePreview feature flag.
Remove the metrics add-on that scrapes Prometheus metrics using the
az aks updatecommand.az aks update --disable-azure-monitor-metrics --name $CLUSTER_NAME --resource-group $RESOURCE_GROUPDisable scraping of control plane metrics on the AKS cluster by unregistering the
AzureMonitorMetricsControlPlanePreviewfeature flag using theaz feature unregistercommand.az feature unregister "Microsoft.ContainerService" --name "AzureMonitorMetricsControlPlanePreview"
FAQ
Can I scrape control plane metrics with self hosted Prometheus?
No, you currently can't scrape control plane metrics with self hosted Prometheus. Self hosted Prometheus can only scrape the single instance depending on the load balancer. The metrics aren't reliable, as there are often multiple replicas of the control plane metrics are only visible through managed Prometheus
Why is the user agent not available through the control plane metrics?
Control plane metrics in Kubernetes don't have the user agent. The user agent is only available through the control plane logs available in the diagnostic settings.
Next steps
After evaluating this preview feature, share your feedback. We're interested in hearing what you think.
To learn more about AKS control plane metrics, see the list of default metrics for AKS control plane.

Azure Kubernetes Service
Povratne informacije
Stiže uskoro: Tokom 2024. godine postepeno ćemo ukidati probleme sa uslugom GitHub kao mehanizam povratnih informacija za sadržaj i zameniti ga novim sistemom povratnih informacija. Dodatne informacije potražite u članku: https://aka.ms/ContentUserFeedback.
Prosledite i prikažite povratne informacije za