In the Microsoft Priva portal (preview), visualizations and insights about personal data in your organization are found on the Reports page in privacy risk management, and the Reports section of the Overview page.
On the Overview page
The Overview page in privacy risk management has a Reports section containing a Personal data type instances card and a Top locations with sensitivity labels card.
Personal data type instances
The Personal data type instances card helps to highlight the diversity of personal data types detected in your organization’s content across your data landscape. The circle chart and bar graph show the approximate aggregate count of unique instances of sensitive information types found within your content, broken out by data location. Sensitive info types (SITs) are pattern-based classifiers that detect sensitive information like Social Security or credit card numbers. If a content item contains three credit card numbers and one Social Security number, that item is considered to contain two unique SITs and four instances of a SIT. Select Explore reports to go to the Reports page.
Top locations with sensitivity labels
The Top locations with sensitivity labels card displays a relational representation of the number of content items that have sensitivity labels, broken out by data location. Hover over a box for a specific data location to display the number of content items that contain a sensitivity label. Select Explore more sensitivity labels to go to the Content explorer area, where you can view the specific sensitivity labels in your organization and the number of items with each label applied.
On the Reports page
The Reports (preview) page contains insights and the full array of reports about personal data in your organization's data landscape. Data insights cover the locations of Microsoft 365, Microsoft Azure (preview), and Amazon Web Services S3 (preview).
Many of the cards on the Reports (preview) page show breakdowns by data location. If you want to limit your view to just one or more locations, select the Microsoft 365, Azure (preview), or AWS (preview) buttons at the top of the Reports page to filter your view.
Key insights
Content items with the most personal data
Content that contains a large amount of personal data might present a higher risk of exposure. You might want to review such items to ensure they're covered by a privacy risk management policy. The Content items with the most personal data card displays the number of unique personal data types detected, how many unique content owners have been identified, and how many data subjects have been identified according to the data matching settings for subject rights requests. Select Explore to view your content items that contain the most personal data according to your settings.
Other Other insights, select View summary for a summary view of the items found. You can also choose to Explore these findings to preview individual files. This view shows a maximum of 100 items. Users in the Privacy Management role group can select files to review details and determine relevance, and export the list in .csv format for reference.
Active alerts over time
The Active alerts over time card shows a snapshot of active alerts triggered by policy matches. Over time, this view can help you more easily detect abnormalities like large spikes in volume. Select View alerts to go to the Alerts page, where you can investigate alerts and create issues in order to remediate.
Privacy regulations
This card introduces insights from Microsoft Purview Compliance Manager to show how the completion of certain actions in Priva can improve your privacy posture. The Privacy score indicates your rate of progress in completing controls related to data privacy regulations. Your score becomes a more helpful tool to strengthen your privacy posture when you build assessments in Compliance Manager for the regulations that are the most relevant to your organization. Select View improvement actions to view a filtered list of actions with detailed implementation guidance in Compliance Manager. Learn more details about how Priva works with Compliance Manager.
Personal data type instances by region
For multi-geo environments, this tile regionally aggregates personal data type instances found within your content, based on the regions in which this content is hosted. For single-region organizations, this tile shows one dot representing your Microsoft 365 location. Hovering over dots on the map will show the approximate count of personal data type instances discovered in that region.
Policy trends
The policy trends cards provide dynamic visualizations of trends found in your organization’s data. These graphs can be filtered by characteristics like spans of time, data type, or the locations of data. Use the dropdown menu options to adjust your view. Hovering over lines in the graph will allow you to see stats related to that specific point in time.
Results related to policies include data from policies in both Testing and On modes. If no policies of a particular type are active, the related graphs show no results.
Personal data found in organization
The Personal data found in organization card shows trends in how much personal data matching your policy settings has been detected over time and where it's located. Isolate your view of data by location, data type, or timeframe by adjusting the dropdown menu options.
Overexposed personal data
The Overexposed personal data card shows trends related to data overexposure policies. It can help you identify sharing behaviors over time by users in your organization, covering locations within and beyond Microsoft 365, where content with personal data could be at risk of overexposure. Isolate your view of data by location, data type, or timeframe by adjusting the dropdown menu options.
Data transfers detected in organization
The Data transfers detected in organization card shows trends related to data transfer policies and applies only to data in your Microsoft 365 environment. It provides a view of how data is moving within your organization, either between departments or between regions for multi-geo organizations. Isolate your view of data by location, data type, or timeframe by
Unused personal data
The Unused personal data card shows trends related to data transfer policies and applies only to data in your Microsoft 365 environment. It gives insights into how long your organization stores content containing personal data and how your policies could improve your handling of this data over time. Isolate your view of data by location, data type, or timeframe by
Classification
Top 5 sensitivity labels
The Top 5 sensitivity labels card indicates which five sensitivity labels are applied most often to content items in your data landscape, broken down by data location. Select Explore more sensitivity labels to go to the Content explorer area, where you can view the specific sensitivity labels in your organization and the number of items with each label applied.
The Top 5 sensitive information types card indicates which five SITs appear most frequently in content items in your data landscape, broken down by data location. Select Explore more sensitive info types to go to the Content explorer area, where you can view the specific SITs in your organization and the number of items in which each SIT is detected.
Top locations with sensitivity labels
See this card's description, above.
In the classic Microsoft Purview compliance portal, visualizations and insights about personal data in your organization are located on the Overview and Data profile pages in privacy risk management.
To begin, go to Privacy Risk Management in the Microsoft Purview compliance portal and view these pages:
- Overview: Provides an overall view into your organization’s data in Microsoft 365. Privacy administrators can monitor trends and activities, identify and investigate potential risks involving personal data, and springboard into key activities like policy management or subject rights request actions.
- Data profile: Provides a snapshot of the personal data your organization stores in Microsoft 365. This page helps you visualize where personal data lives, what types are the most prevalent in your organization, and how many different types exist across locations in your Microsoft 365 environment. You can also explore personal data from this location.
As your data changes and Priva makes new findings, the information shown on these pages updates. It can take up to 24 hours for new data to be represented in the charts.
Explore the overview page
Tip
If you're accessing privacy risk management in the new Priva portal (preview), the data described below can be found on the Reports page.
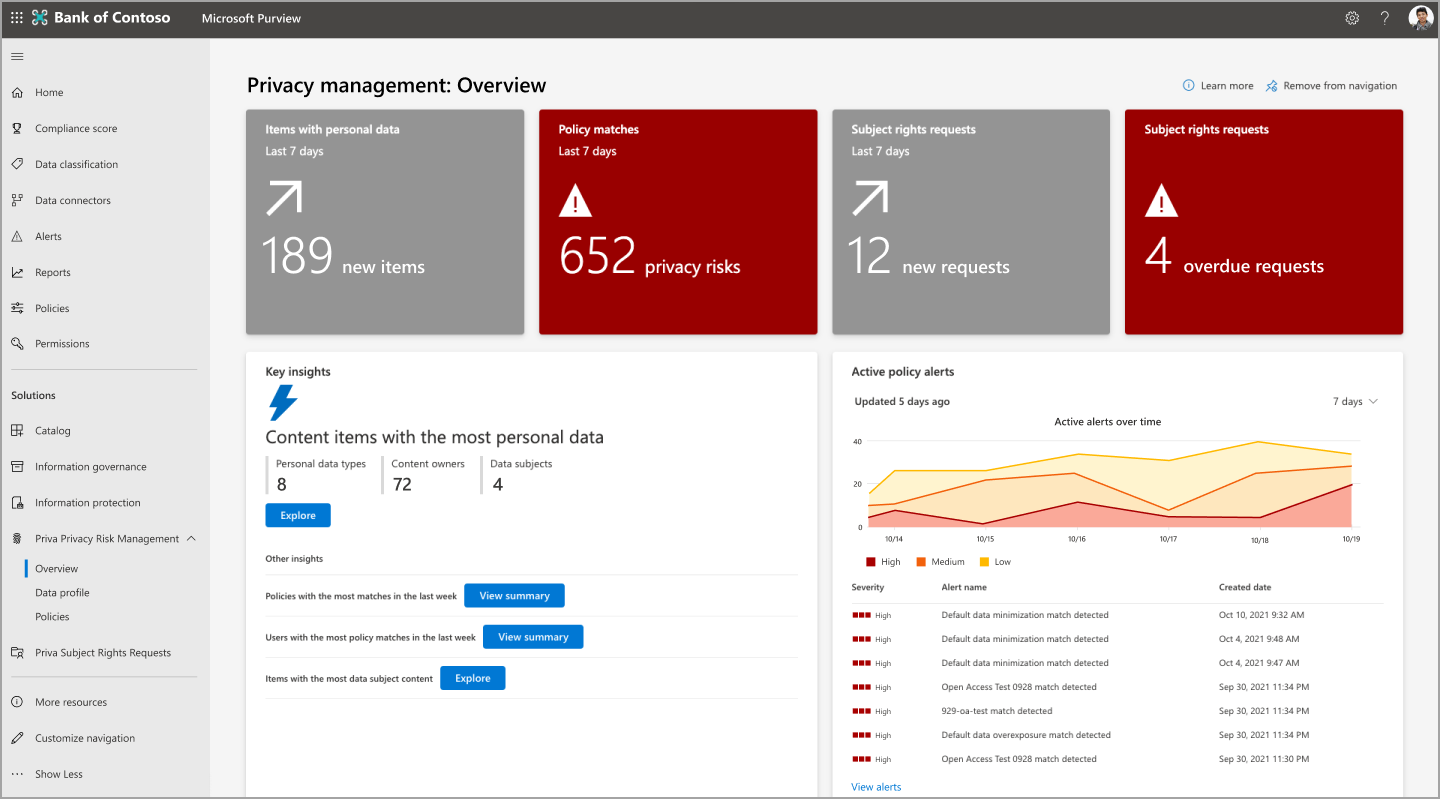
The Overview page, displayed below, consists of three main sections:
- Tiles at the top of the page provide essential recent statistics about your data.
- The Key insights section provides investigative opportunities into trends and areas of key interest.
- The trendline graphs provide other perspectives on your data environment.
Overview page:
Tiles and charts
Top tiles
Items with personal data
To see Priva's automated discovery capabilities at work, review the Items with personal data tile. This tile shows how many new items containing personal data based on your settings have been discovered in your organization’s Microsoft 365 environment over the last seven days. Selecting this tile loads a view of the newest 100 items discovered.
Policy matches over past 7 days
When policies are set within Priva Privacy Risk Management, your data is evaluated based on your policies for certain conditions that might present privacy risks. Policy matches indicate data discoveries that might need further review or remediation. This tile shows how many policy matches have occurred within the last seven days. Matches appear here whether policies are on or are running in testing mode, so you can see the results of all your active policies. Selecting this tile takes you to a filtered view of the Policies page of Privacy Risk Management, showing the policies that have had a match occur within the past seven days.
Subject rights requests
The overview page includes a tile that shows how many subject rights requests have been created over the last seven days. A second tile, if applicable, shows how many requests are overdue based on your designated deadlines and might need immediate attention. Selecting these tiles takes users with the appropriate permissions to the main Subject Rights page.
Key insights
Content items with the most personal data
Content that contains a large amount of personal data might present a higher risk of exposure. You might want to review such items to ensure they're covered by a Privacy Risk Management policy. To help raise these items to your attention, the overview page provides a view into your content items that contain the most personal data according to your settings. Here you can see the number of unique personal data types detected, how many unique content owners have been identified, and how many data subjects have been identified according to the data matching settings for subject rights requests.
Select View summary for a summary view of the items found. You can also choose to Explore these findings to preview individual files. This view shows a maximum of 100 items. Users in the Privacy Management role group can select files to review details and determine relevance, and export the list in .csv format for reference.
Policies with the most matches in the last week
This insight showcases which policies have been matched the most frequently over the last seven days, whether in “On” mode or “Testing.” It helps illustrate the performance of your policies and the effects of ongoing work as your Priva users refine their privacy behaviors.
Select View summary for a summary of the top 10 policies matched and the content owners of the associated content. You'll also see how many user notifications were sent due to these policy matches and the number of user actions taken. Select Investigate to view the Policies page in Privacy Risk Management, filtered to show the policies from the summary view. This investigative view shows statistics for the full lifetime of the policy. Select it to see details such as when matched items were initially detected.
Users with the most policy matched in the last week
This insight also addresses matches from policies in either “Testing” or “On” mode. It allows you to view a summary of the users with the most policy matches over the last week and which policies they match. This includes totals of the unique content owners, notifications sent to these users, and how many actions were taken from those notifications. Selecting Investigate takes you to the policies page, filtered to show the policies from the summary view. In the investigative view, you won't find user information, but you can select a policy to see policy details related to these matches.
Items with the most data subject content
This insight surfaces content items containing the personal data of the most data subjects. To receive these insights, your organization needs to set up data matching for subject rights requests.
These items can help confirm your data matching configuration and help you mitigate privacy risks related to these items. Select View summary for a summary view. Select Explore for a detailed view of up to 100 of these items. Here you can preview these items and determine relevance, and export the list in .csv format.
Privacy regulations
This card introduces insights from Microsoft Purview Compliance Manager to show how the completion of certain actions in Priva can improve your privacy posture. The Privacy score indicates your rate of progress in completing controls related to data privacy regulations. Your score becomes a more helpful tool to strengthen your privacy posture when you build assessments in Compliance Manager for the regulations that are the most relevant to your organization. Select View improvement actions to view a filtered list of actions with detailed implementation guidance in Compliance Manager. Learn more details about how Priva works with Compliance Manager.
Trendline graphs
For dynamic visualizations of trends found in your organization’s data, consult the trendline graphs. These graphs can be filtered by characteristics like spans of time, data type, or the locations of data. Use the dropdowns provided to adjust your view. Hovering over lines in the graph will allow you to see stats related to that specific point in time.
Results related to policies include data from policies in both “Testing” and “On” mode. If no policies of a particular type are active, the related graphs show no results.
Active policy alerts
This area shows a snapshot of active alerts triggered by policy matches. Over time, this view can help you more easily detect abnormalities like large spikes in volume. Select View alerts to navigate to the policies page within Privacy Risk Management, where you can further investigate alerts and create issues for remediation.
Personal data found in organization
This graph shows trends in how much personal data matching your settings has been discovered over time in your Microsoft 365 environment and where it's located. It will begin populating after Priva has been running for sufficient time and after content with personal data has been found within SharePoint, OneDrive, Teams, and/or Exchange.
Data transfers detected in organization
This graph is related to data transfer policies. It provides a view of how data is moving within your organization, either between departments or between regions for multi-geo organizations.
Unused personal data
This graph is related to data minimization policies. It gives insights into how your organization is storing content containing personal data and how your policies might improve your handling of this data over time.
Overexposed personal data
This graph is related to data overexposure policies. It can help you identify sharing behaviors over time within your organization and locations where content with personal data might be overexposed, for example by being shared publicly, shared with an external user, or shared widely within your organization.
Subject rights requests by regulation
This view provides insights into what regulations most prevalently drive your subject rights requests over time. This graph’s legend shows the names of the trending regulations. Hovering over the trend lines shows the totals of subject rights requests open for that regulation during the selected time.
Subject rights requests by status
This graph displays how your organization is doing with completing subject rights requests, broken out into requests that are either Active, Closed, or Overdue. Findings here might help indicate where you could benefit from allocating more resources to closing out your requests and meeting targets.
Additional data views
Subject rights requests at a glance
This view provides a high-level view of active subject rights requests, including the time remaining to complete requests by their deadlines. It summarizes how many total requests you have, how many are active, and how many are closed. Select View all requests to go to the subject rights request page, where you can view further details and work on the active requests to progress them to completion.
Subject rights requests by residency
This map view helps you visualize your volume of subject rights requests by the residency of the data subjects. Hovering over a bubble identifies the region and the total of subject rights requests opened on behalf of residents there.
When insights start to populate
The Overview page starts to populate with initial insights within the first 72 hours after your organization begins using privacy risk management. As you continue to use it, the overview page will refresh to continue to provide current information.
The Overview page shows insights generated from the default policies that are running when you start Privacy Risk Management. These policies evaluate your organization's data against three key risk scenarios: data minimization, data overexposure, and data transfers.
The insights shown are based on user activity detected from the point at which your organization began to use Priva. Data in the Data transfers detected in organization and Overexposed personal data cards will surface within 48-72 hours if policy matches are detected. The Unused personal data card will show insights within 72 hours of starting Priva for data that hasn't been modified within the last 30 days.
Learn more about creating, customizing, and working with Privacy Risk Management policies.
Explore the data profile page
Tip
If you're accessing privacy risk management in the new Priva portal (preview), the data described below can be found on the Reports page.
The Data profile page provides a snapshot view of the personal data your organization stores in Microsoft 365 and where it lives. It also gives insight into the types of data you store. The charts on the page are described below.
Data profile page:
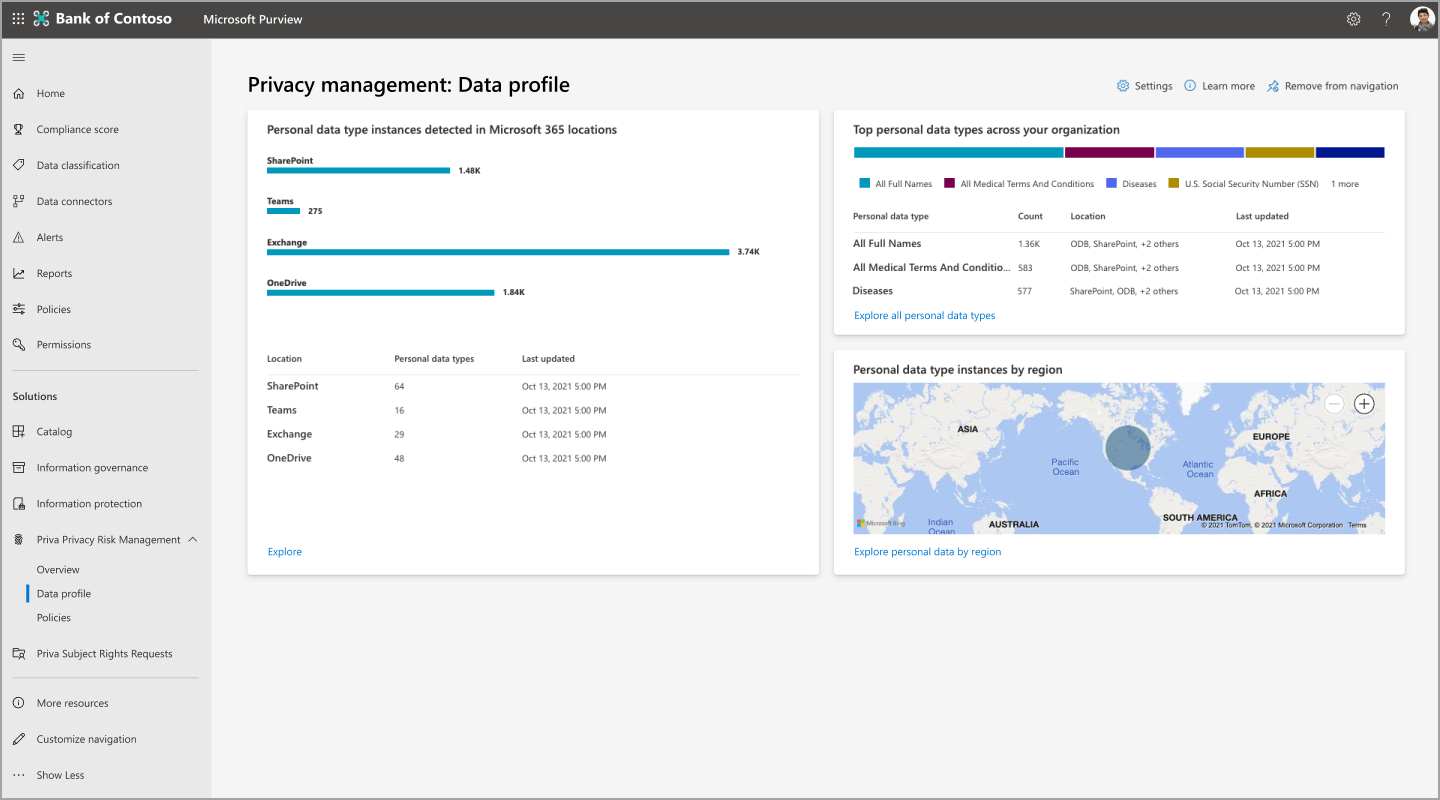
Personal data type instances detected in Microsoft 365
This tile helps you visualize how much personal data exists in your Microsoft 365 environment based on your settings and how that data is distributed across Exchange, OneDrive, SharePoint, and Teams.
The bar graph shows the approximate aggregate count of unique personal data type instances found within your content. Examples of data types could include things like credit card numbers and social security numbers. Therefore, a discovered file that contains three credit card numbers and one social security number would contain two unique personal data types and four instances. The lower portion of this tile shows the unique personal data types within each Microsoft 365 location. It provides a view into the diversity of personal data types detected in your organization’s content.
Top personal data types across your organization
This tile provides a snapshot of the top personal data types detected in your environment, along with information on how many items contain that personal data type and in what locations.
Personal data type instances by region
For multi-geo environments, this tile regionally aggregates personal data type instances found within your content, based on the regions in which this content is hosted. For single-region organizations, this tile shows one dot representing your Microsoft 365 location. Hovering over dots on the map will show the approximate count of personal data type instances discovered in that region.
Exploring content
Selecting Explore on any data profile tile opens the content explorer. At this time, you can't search for a specific content item, and you won't see Teams data in this view. This means that numbers within the content explorer might not match the numbers shown on the data profile page, since the data profile page does include Teams content. Privacy administrators who want further insights into their privacy data can do so here based on personal data type (sensitive information type) or by location (Exchange, OneDrive, or SharePoint).
Legal disclaimer
Microsoft Priva legal disclaimer